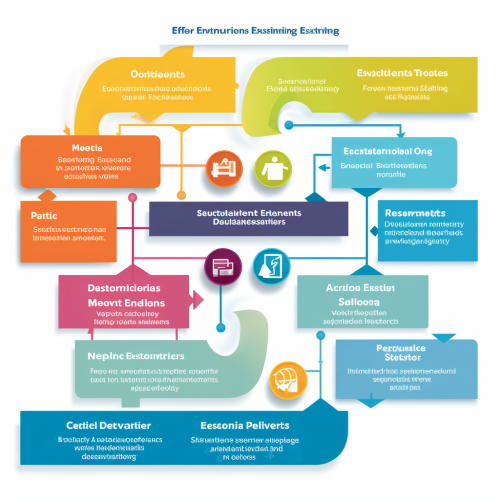
Visualize cost-saving benefits of IT operations on company performance.
Prompt
License
Free to use with a link to 2moonsai.com
Similar Images
electric sockets with expensive electricity. Realistic photo.
A Group Cost Optimisation Manager for a global provider of transport solutions across rolling stock, signalling services and turnkey
"A dynamic 3D animated scene illustrating the financial benefits of CFC for Colorado. Visualize a map of Colorado, with areas receiving benefits highlighted in vibrant colors. Above the map, a meter or graph shows a 6% increase in federal funding. Around the map, diverse groups of people--families, elderly, and caregivers--celebrate the benefits. The environment is positive and hopeful, with a backdrop of Colorado landscapes
Transparent savings jar filled with coins at the center, with the label "Your Savings" hovering above. Flanking the jar, place photovoltaic panels on one side and a tree representing clean air on the other, symbolizing the two programs. Behind the jar, a rising savings graph for each month of program usage. Small icons at the bottom showcasing financial benefits like reduced electricity bills, grants, and increased property value. Medium: Hyper-realistic photography. Style: A blend of modern advertisement with a touch of eco-friendliness. Lighting: Soft ambient with a hint of golden hour glow. Colors: Gold and green tones representing savings and ecology, set against a blue background symbolizing clean air and environment. Composition: Canon EOS 5D Mark IV DSLR camera, EF 50mm f/1.8 STM lens, Resolution 30.4 megapixels, ISO sensitivity: 100, Shutter speed 1/125 second, depth-of-field focus on the jar and tree. --ar 16:9 --v 5.1 --style raw --s 750
Envision a well-structured flowchart that intricately outlines the process of evaluating and refining employee benefits, fostering an enhanced Functional Operating Capacity (FOC) and uplifting organizational productivity. The flowchart initiates with a broad 'Benefits Evaluation' box that branches into several meticulous analysis paths including 'Data Analytics', 'Employee Feedback', and 'Health Metrics Analysis'. The 'Data Analytics' path delves into scrutinizing the utilization and effectiveness of current benefits, branching further into sub-categories like 'Usage Statistics' and 'Cost-Benefit Analysis'. Simultaneously, the 'Employee Feedback' path unfolds into 'Survey Responses' and 'Focus Groups', aiming to gather qualitative insights on employee satisfaction and perceived value of the benefits provided. The 'Health Metrics Analysis' pathway, on the other hand, zeroes in on evaluating the impact of current benefits on employees' health and Functional Operating Capacity, subdividing further into 'Physical Health Metrics' and 'Psychological Well-being Assessment'. These analysis paths converge into a central point labeled 'Benefits Refinement', signifying the amalgamation of insights derived. From here, a well-defined path named 'Benefits Optimization' emanates, symbolizing the iterative process of tweaking the benefits scheme based on gathered data to better cater to employee health and wellness needs. This section opens up to show various refined benefits like 'Improved Healthcare Coverage', 'Fitness Stipends', 'Mental Health Support', and 'Flexible Work Arrangements'. Finally, the flowchart culminates in a box labeled 'Enhanced Functional Operating Capacity & Organizational Productivity', illustrating the ultimate goal of this rigorous analysis and [...]
hr tools, artificial iteligence, big data, automatization, graphic in yellow and navy blue colors with no text included
make an icon for the website, the company is engaged in cargo transportation, processing, energy and oil production and without a background --q 0.5
Hourly Car Rental: Is It a Cost, illustration, --ar 3:2 --v 5.0
Image Description: Within the intimate setting of a cozy home, we subtly illustrate the concept of optimizing one's living space for enhanced comfort, energy efficiency, and cost savings. Main Focus: The central element of the image is a serene living room, where every detail subtly contributes to an optimized environment. The room exudes a welcoming ambiance that seamlessly integrates optimization into daily life. Smart Home Technology: Subtle smart home devices, like a sleek thermostat, energy-efficient LED lighting, and an inconspicuous central hub, are strategically placed throughout the room. They blend seamlessly with the décor, reflecting a harmonious integration of technology. Efficient Lighting: Soft, energy-efficient LED lights cast a warm glow, illuminating the room without being obtrusive. The lighting is not just practical; it's part of the optimization strategy. Temperature Control: A barely visible smart thermostat on the wall is set to an energy-saving temperature, with a nearly invisible hand making a subtle adjustment. The thermostat complements the room's aesthetics and silently contributes to energy efficiency. Window Optimization: The curtains or blinds are drawn just enough to allow natural light to filter in, reducing the need for artificial lighting during the day. The window frames are sealed tightly to prevent drafts, but this is subtly hinted rather than overtly displayed. Hidden Sensors: Concealed sensors are strategically placed around the room to monitor temperature, humidity, and occupancy discreetly. These sensors quietly communicate with the smart home system to optimize comfort while minimizing energy waste. Energy-Saving Appliances: Subtle symbols on appliances indicate their energy-efficient nature. For example, a washing [...]
a photo, Precise employee benefits, data-driven welfare strategy, cost-effective balance, targeted benefit policy, reduce unnecessary expenses, enhance attractiveness of benefits, improve employee satisfaction, positive company perception, with light pink background
A woman in a front-facing view, slightly looking to her left, holding cash in both hands with a subtle smile. She conveys the satisfaction of saving on card processing fees by using cash instead. The background is simple and light, with focus on her happy expression and the cash in her hands. The overall feel is modern, clean, and professional, emphasizing the benefits of cash saving, --ar 16:9

View Limit Reached
Upgrade for premium prompts, full browsing, unlimited bookmarks, and more.
Get Premium
Limit Reached
Upgrade for premium prompts, full browsing, unlimited bookmarks, and more. Create up to 2000 AI images and download up to 3000 monthly
Get Premium
Become a member
Sign up to download HD images, copy & bookmark prompts.
It's absolutely FREE
 Login or Signup with Google

Become a member
Sign up to download HD images, copy & bookmark prompts.
It's absolutely FREE
 Login or Signup with Google

Limit Reached
Upgrade for premium prompts, full browsing, unlimited bookmarks, and more.
Get Premium


 Download Image (SD)
 Download Image (HD)


