


Visual representation of sarcoma risk score with color zones.
Prompt
a visual representation of a risk score for sarcoma. The image should include three distinct zones: low, moderate, and high risk. A numerical value should be displayed in the center to indicate the specific risk level, with a high risk score being visually emphasized. The background of this photo should be white. the risk score screen white, grey and purple.


 Download Image (SD)
 Download Image (HD)
Share


License
Free to use with a link to 2moonsai.com

Similar Images

A visual representation of a lemniscate (infinity symbol) intertwining with Human body by George Ault

Generate a digital art for A digital art scene showing a project manager overseeing a team working on computers, with a visual representation of software implementation and a graph showing a 20% increase in productivity. Use light gray as the background color. --ar 1:1

an ancient scroll with musical score and doodles of hearts and arrows
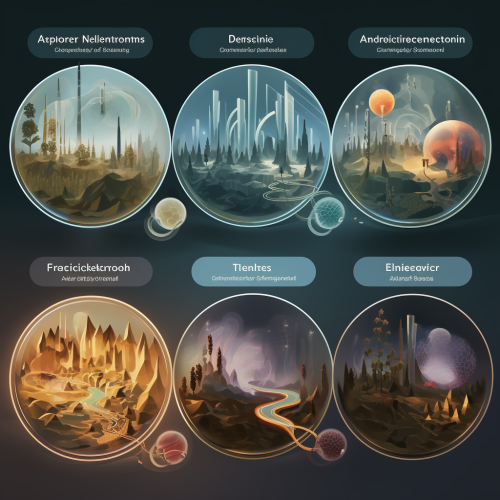
visual representation of 4 types of courses, each more advanced than the previous

Design a surreal landscape where a river of currency flows from a mountain peak of traditional assets into a futuristic city skyline built of alternative assets, all under a sky filled with ticking clocks and risk-adjusted return equations --ar 16:9


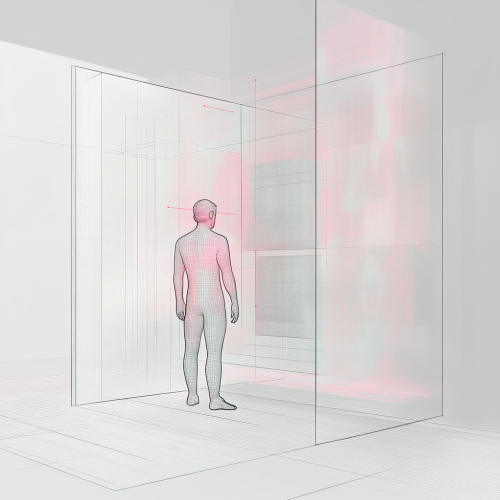
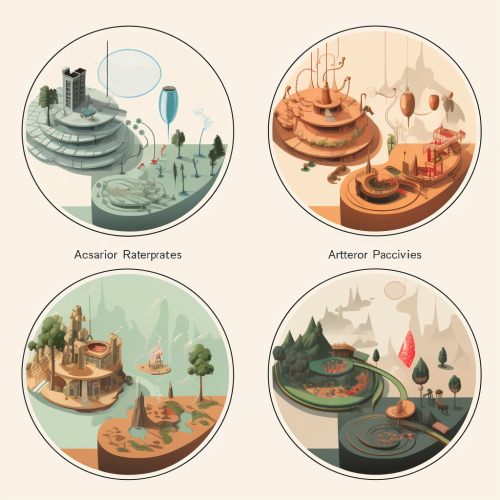
a plan of a body and screen as segmented zones of engagement Active and passive regions with user central in a confined zone representing limited movement and heightened visual concentration

Generate an image of a balanced scale symbolizing the importance of managing risk in trading.

A tasteful, photorealistic visual representation of an ethical manufacturing workplace

Design a visual representation of an AI assistant analyzing customer reviews, extracting key data points like date, product, rating, summary, action items, competitor mentions, and sentiment. The scene should emphasize clarity, precision, and efficiency in data processing, reflecting the AI's role in enhancing business decisions. Minimalist, crisp white background, no grunge, splash, dust --ar 16:9 --v 6.1

A visual representation of a cloud with interconnected digital components that can expand or contract, symbolizing the scalability of the DynamicWeb platform. Calm Scandinavian style

View Limit Reached
Upgrade for premium prompts, full browsing, unlimited bookmarks, and more.
Get Premium
Limit Reached
Upgrade for premium prompts, full browsing, unlimited bookmarks, and more. Create up to 2000 AI images and download up to 3000 monthly
Get Premium
Become a member
Sign up to download HD images, copy & bookmark prompts.
It's absolutely FREE
 Login or Signup with Google
Become a member
Sign up to download HD images, copy & bookmark prompts.
It's absolutely FREE
Login or Signup with Google
Limit Reached
Upgrade for premium prompts, full browsing, unlimited bookmarks, and more.
Get Premium