


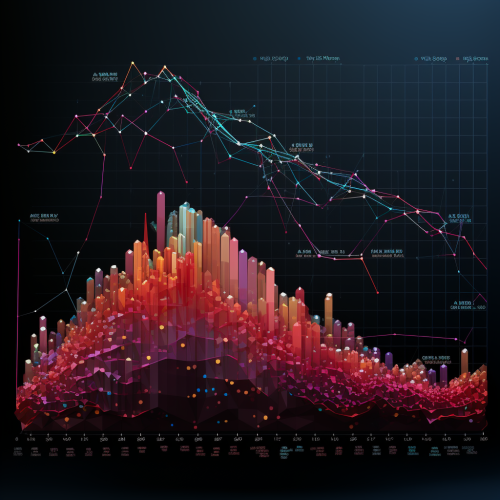
Unlocking private investment data for analysis and action
Prompt
Vault or safe symbolizing restricted access to private investment data Advisor using a digital tool or key to unlock and access the data Data streams transforming into graphs and charts on a computer screen A progress bar showing data being analyzed and acted upon, kodak photo, poster style, --ar 2:1


 Download Image (SD)
 Download Image (HD)
Share


License
Free to use with a link to 2moonsai.com

Similar Images
a visualization of the total voteable supply of a crypto currency increasing set in space using a graph where with shades of red


illustration, business man looking at data, smart dress, light blue-grey, dark grey, red, sharp illustration, dark gouache, Illustration in the style of artgerm and charlie bowater and atey ghailan and mike mignola, perfect shading --v 6.0 --s 250
generative AI icon with data generating data --s 250 --v 5.0

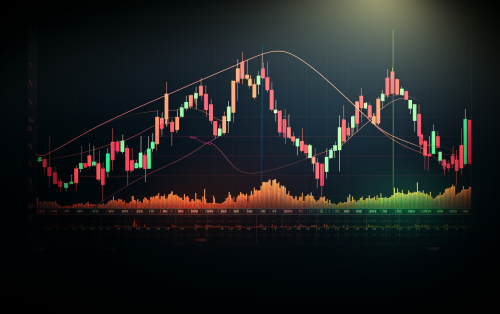
2d, cartoon style, background for website, financial, stocks --v 5.0


realistic iron safe with door ajar, data glowing inside, person holds digital key in his hand, graphs and charts around the safe, progress bar above the safe, realistic, kodak photo, --ar 2:1


data analysis in the sky, lots of numbers, one of the numbers is glowing brighter than the rest

a woman who would be the best private equity investor in the world powered by artificial intelligence light dark color skin render as a 2.5d Pixar style character

Vault or safe symbolizing restricted access to private investment data Advisor using a digital tool or key to unlock and access the data Data streams transforming into graphs and charts on a computer screen A progress bar showing data being analyzed and acted upon, realistic, kodak photo, --ar 2:1


a workspace setup with a detailed topographic map spread on a table below. This scene emphasizes the interplay between temporal and spatial scales. Embedded within the map, place contrasting annotations or overlays: one zone showcasing averaged or 'lumped' data and another showing intricate, 'distributed' data points. --ar 21:9

Vault or safe symbolizing restricted access to private investment data Advisor using a digital tool or key to unlock and access the data Data streams transforming into graphs and charts on a computer screen A progress bar showing data being analyzed and acted upon, kodak photo, poster style
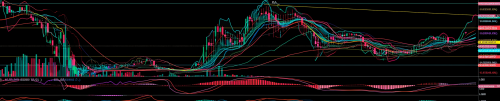
FTX crypto exchange data trading funds analysis technical --ar 16:10

View Limit Reached
Upgrade for premium prompts, full browsing, unlimited bookmarks, and more.
Get Premium
Limit Reached
Upgrade for premium prompts, full browsing, unlimited bookmarks, and more. Create up to 2000 AI images and download up to 3000 monthly
Get Premium
Become a member
Sign up to download HD images, copy & bookmark prompts.
It's absolutely FREE
 Login or Signup with Google
Become a member
Sign up to download HD images, copy & bookmark prompts.
It's absolutely FREE
Login or Signup with Google
Limit Reached
Upgrade for premium prompts, full browsing, unlimited bookmarks, and more.
Get Premium