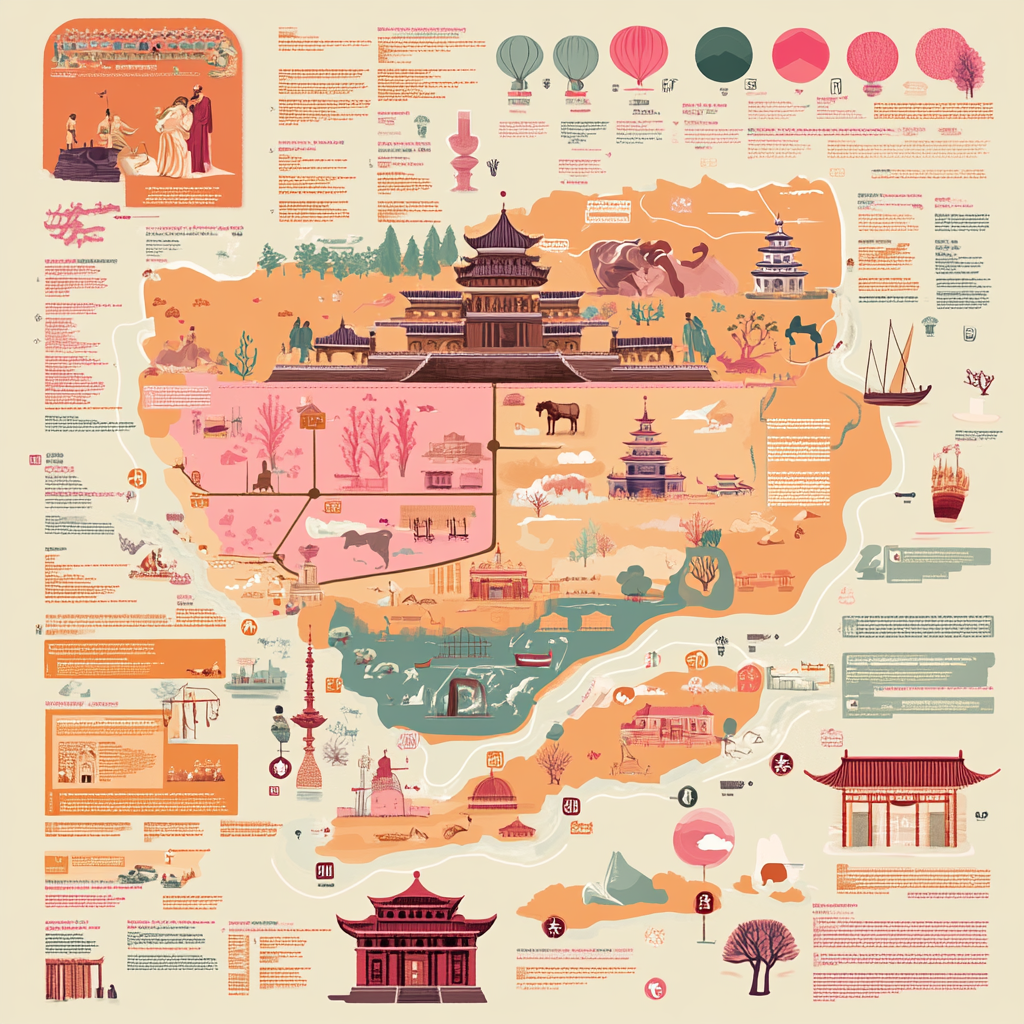
Rise and Fall of Major Civilizations Infographic
Prompt
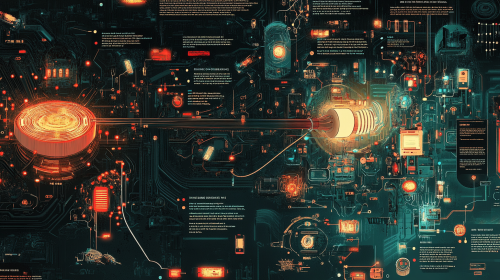
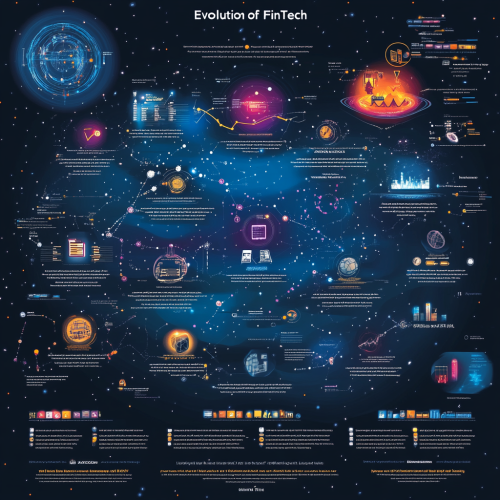
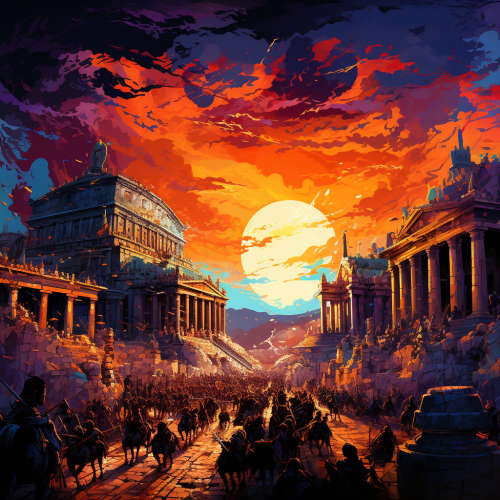
Illustrated map-like infographic highlighting the rise and fall of major civilizations (e.g., Ancient Greece, Roman Empire, Chinese dynasties), social/political movements (e.g., revolutions, reforms), and the evolution of cultural practices (e.g., art, music, literature), using a rich, historical color palette. Include stylized icons, timelines, and regional illustrations. The page is filled with one main object and additional details around it. Color palette of pink, orange and blue --v 6.1 --style raw
License
Free to use with a link to 2moonsai.com
Similar Images
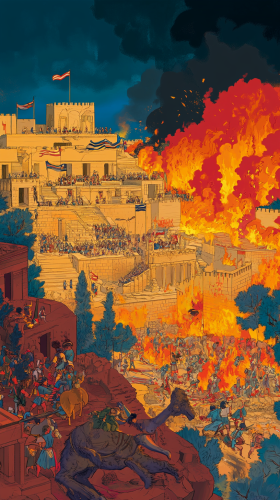
Illustrate the rise and fall of Minoan civilization, with the left side depicting the grandeur of Knossos Palace, showcasing prosperous residents engaged in vibrant daily activities. On the right side, illustrate the turning point with the arrival of external invaders, as soldiers rush toward the palace, creating chaos and panic. The background features flames on the city walls and destroyed buildings, symbolizing the internal turmoil and external threats. In the distance, depict Mycenaean warriors taking over Crete, marking the rise of a new civilization. The overall color scheme transitions from warm and glorious tones to darker shades, conveying the shift in history and cultural change --ar 9:16
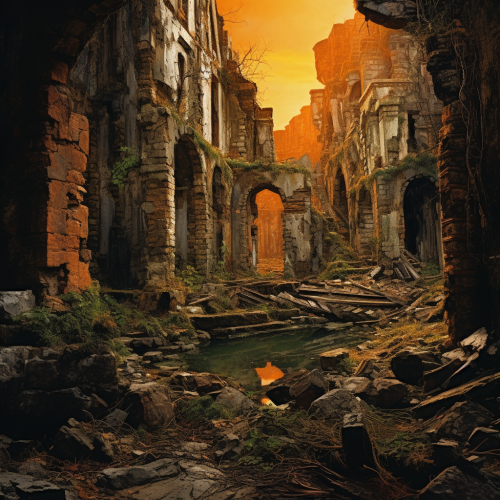
Peter Lik style, An ancient ruin, reclaimed by nature beside a modern city showing signs of decay and neglect, the transient nature of civilizations, past and present, from vulnerability to a contemplative realization of the cyclical nature of life and civilizations
Graphic design, exchange rate rise and fall candle graph, box chart, graph trapped in ice, last part rise and fall arrow --ar 16:9 --v 6.0
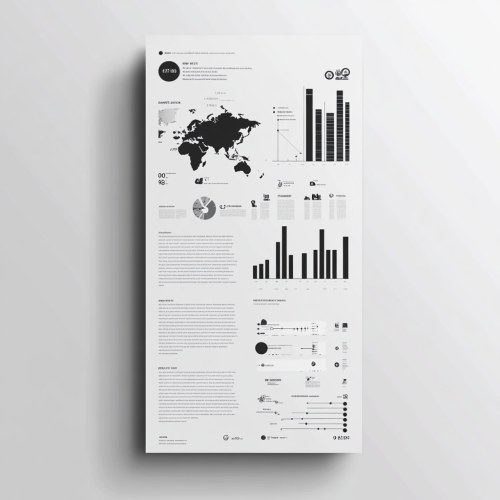
Design a detailed, visually engaging infographic that simplifies complex information into easy-to-understand sections. Use a clean, professional layout with well-organized data points, icons, and charts. The color scheme should enhance readability and the overall flow of the information. Include thoughtful typography and clear labels to ensure that the data is both visually appealing and easy to follow.
A vibrant, eye-catching infographic showcasing various types of visual content. Include miniature representations of charts, graphs, images, and video icons. Use a color palette of blues, greens, and orange. Incorporate abstract human figures interacting with the visual elements. Add a central lightbulb icon to represent insights. Style: modern, clean, and slightly 3D. Include subtle data-like patterns in the background. --ar 16:9 --quality 2 --stylize 750 --v 6.1
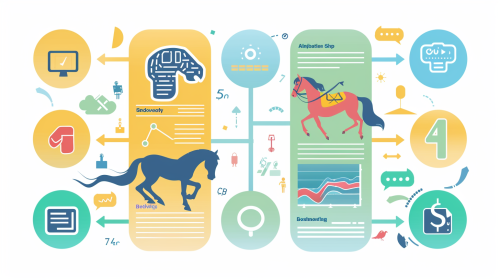
A flat modern infographic showing all four steps of the automatic horse betting purchase process. Step 1: AI brain processes horse racing data. Step 2: CSV file export with racing symbols. Step 3: Data is uploaded to an automated trading system via a computer or cloud. Step 4: Automatic horse betting ticket with a checkmark. Each step is connected by bold arrows from left to right. Light pastel colors (blue, green, yellow) with clear icons, minimalistic yet detailed design, professional layout, hd quality --ar 16:9 --v 6.0
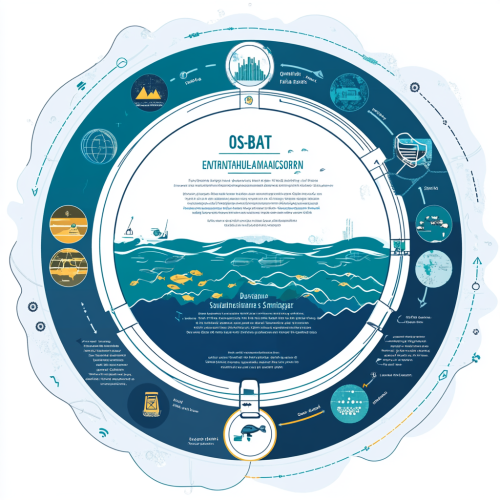
Create an infographic with a central bold circle labeled 'OS-BEAT' at the center, including a tagline that reads 'Baseline Assessment for Sustainable Ocean Management.' Surround the central circle with five smaller circles or segments, each connected to the OS-BEAT hub by lines, forming a unified system. Label the five surrounding circles with the following components: 'Environmental Health Scoring,' 'Blue Economy Opportunity Assessment,' 'Marine Policy Impact Simulator,' 'Global Ocean Observing Dashboard,' and 'Sustainability Certification Standard.' Use a clean, modern style with oceanic and environmental colors like blue, green, and white.
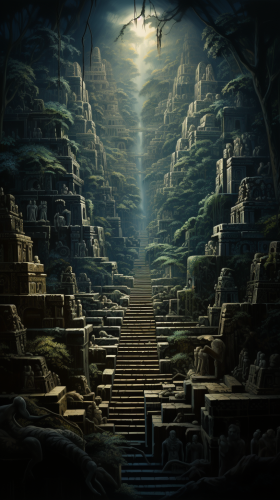
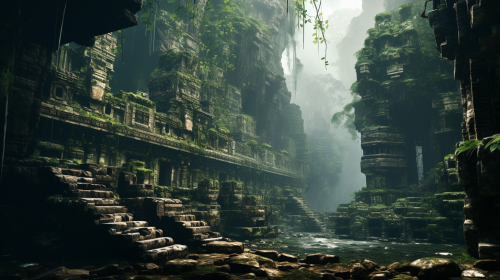
forgotten city, abandoned ancient advanced city in the rainforest, 8k, high resolution, hyper realistic, --ar 16:9
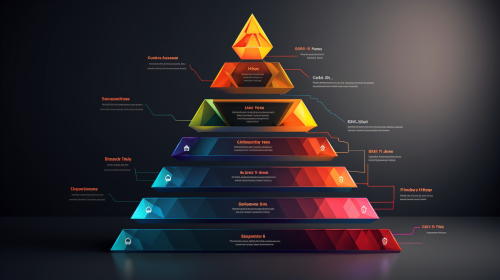
Style: Minimalistic, using brand colors. Prompt: "Develop an infographic visualizing the steps or layers of change-making, from idea inception to community impact.
View Limit Reached
Upgrade for premium prompts, full browsing, unlimited bookmarks, and more.
Get Premium
Limit Reached
Upgrade for premium prompts, full browsing, unlimited bookmarks, and more. Create up to 2000 AI images and download up to 3000 monthly
Get Premium
Become a member
Sign up to download HD images, copy & bookmark prompts.
It's absolutely FREE
 Login or Signup with Google

Become a member
Sign up to download HD images, copy & bookmark prompts.
It's absolutely FREE
 Login or Signup with Google

Limit Reached
Upgrade for premium prompts, full browsing, unlimited bookmarks, and more.
Get Premium




 Download Image (SD)
 Download Image (HD)


