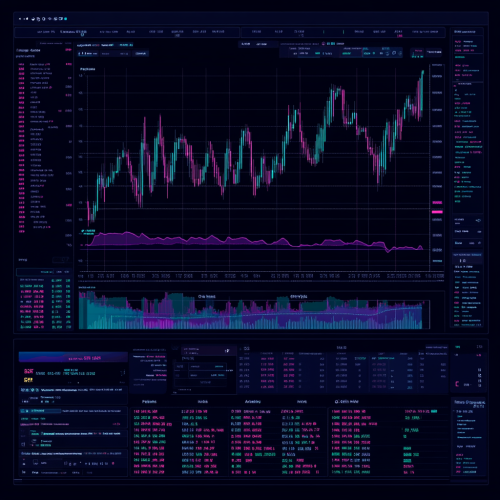
Market Profile TPO Chart
License
Free to use with a link to 2moonsai.com
Similar Images
Before-and-after images of abdominoplasty, fat and flabby tummy vs tucked tummy, rendered in hyper-realistic detail, highlighting the surgical technique and the dramatic improvement in abdominal profile, using Phase One IQ4 for unparalleled clarity.
Infographic on Projected Growth of the Carbon Market: A bar chart or line graph that shows the growth trajectory of the carbon credit market from the present to 2050. Use a contrasting color to highlight your company’s projected share or position in the market, alongside supportive icons like dollar signs or green energy symbols to emphasize growth and opportunity --ar 16:9 --stylize 1000
Market Data and AnalysisCoinMarketCap - coinmarketcap.comOffers comprehensive cryptocurrency market data, including price charts, market cap, and trading volume.CoinGecko - coingecko.comProvides detailed cryptocurrency data, including price, trading volume, and market capitalization.TradingView - tradingview.comFeatures interactive charts, technical analysis tools, and social networking for traders and investors. --s 250
ethereum chart with big green arrow break top and go to the sky --ar 16:9
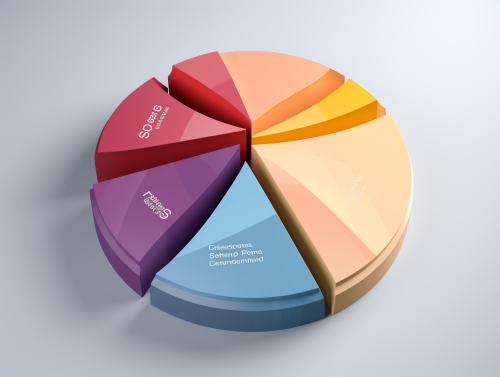
A three-dimensional pie chart with different segments in brand colors, no text or labels, showing how consumer preferences lean towards CSR initiatives. --aspect 4:3 --style raw
A cute room with one monitor showing an FX chart and lotus flowers on both ends. Dragon Quest style game.--v 5 --ar 16:9
Scene representing interest rate changes, a financial chart with peaks and troughs displayed on a computer monitor, indicating market volatility, modern office setup, minimal decor, conveying a sense of economic instability or variation. Photorealistic, highly detailed, 8K resolution --ar 3:2 --v 6.1 --style raw
Minimalistic illustration in a green monochrome style color #00C1A1, on a solid white background, looking like a stock chart going up, simple styling, --ar 16:9 --s 250 --v 6.0
A 3D, 4k, HDR cartoon styled detailed representation of Red and green Candlestick formations from a day trading stock chart
A highly detailed astrological chart wheel, featuring the 12 astrological houses and zodiac signs in a minimalist line drawing style, precise circular geometry, each house marked with intricate symbols, clean lines, and delicate text labeling each zodiac sign, surrounded by subtle celestial patterns like stars and constellations, elegant black and white ink illustration

View Limit Reached
Upgrade for premium prompts, full browsing, unlimited bookmarks, and more.
Get Premium
Limit Reached
Upgrade for premium prompts, full browsing, unlimited bookmarks, and more. Create up to 2000 AI images and download up to 3000 monthly
Get Premium
Become a member
Sign up to download HD images, copy & bookmark prompts.
It's absolutely FREE
 Login or Signup with Google

Become a member
Sign up to download HD images, copy & bookmark prompts.
It's absolutely FREE
 Login or Signup with Google

Limit Reached
Upgrade for premium prompts, full browsing, unlimited bookmarks, and more.
Get Premium


 Download Image (SD)
 Download Image (HD)


