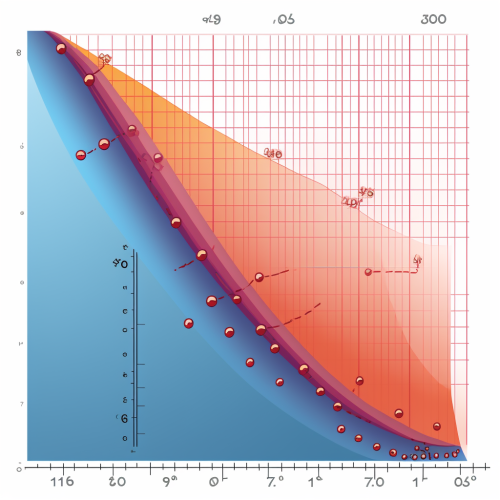
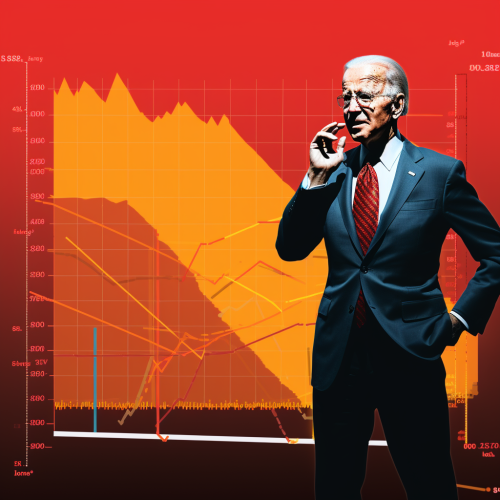
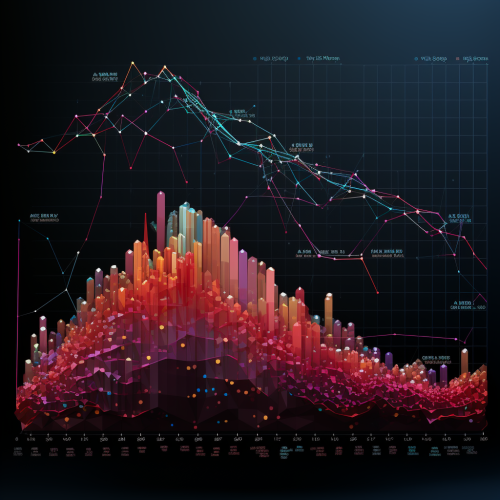
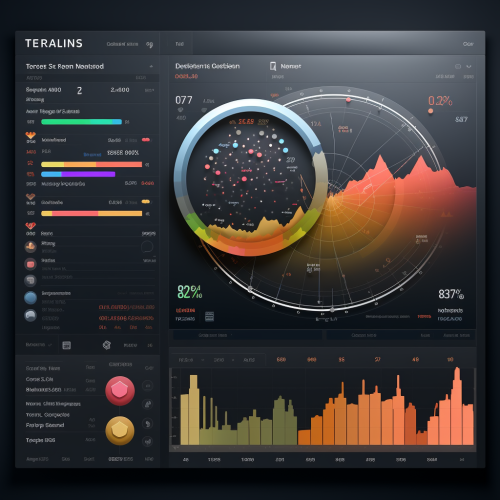
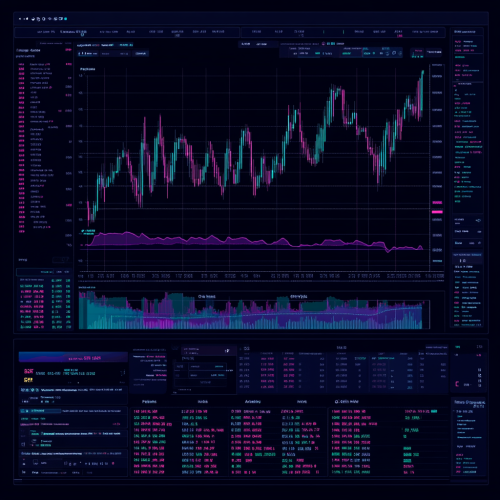
Graph showing inflation forecast trends
Prompt
License
Free to use with a link to 2moonsai.com
Similar Images
Raoul Dufy style black and white woodblock print. Black background. Scene: Weather forecast on psychedelics. --ar 16:3
draw a linear graph with time on x-axis and thermal energy on y-axis that is gradually coming down to 0
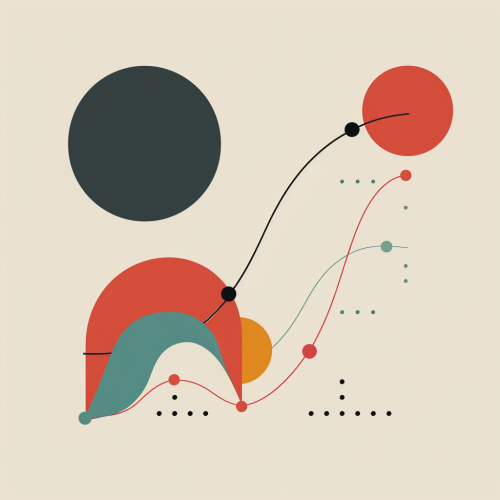
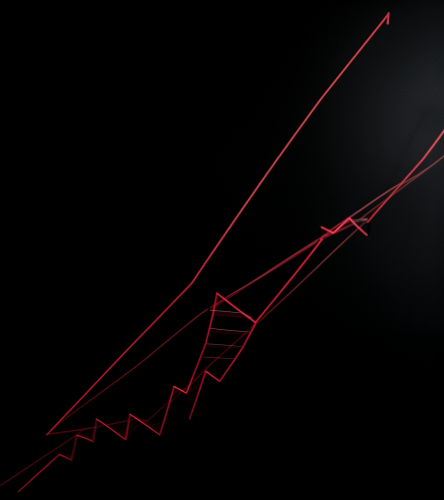
A stylized line graph with an upward trend, symbolizing growth and progress.
Generate a digital art for Digital art depicting a person looking stressed and overwhelmed, surrounded by luxury items like a new car, designer clothes, and gadgets. The background should be light grey. The scene should convey the concept of lifestyle inflation, where increased income leads to increased spending, causing financial strain despite a pay hike. Use colors: light grey, white, and muted tones. --ar 1:1
a visualization of the total voteable supply of a crypto currency increasing set in space using a graph where with shades of red
Moses parting the sea, with his arms raised. The sea is green. There are some green graph bars all over the sea. View from behind. Shocking, realistic image
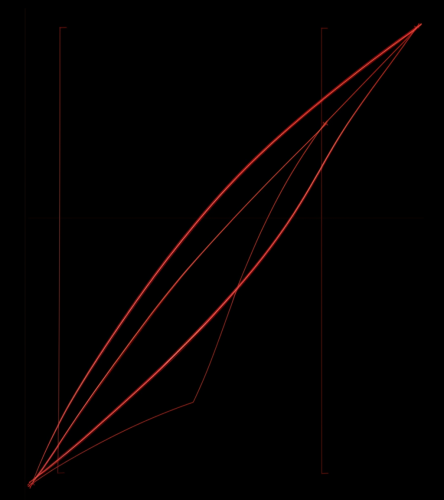
a simple line graph with an x and y axis. Black background. Single thick red line with a downward trajector from left to right --aspect 8:9 --v 5.0
Market Data and AnalysisCoinMarketCap - coinmarketcap.comOffers comprehensive cryptocurrency market data, including price charts, market cap, and trading volume.CoinGecko - coingecko.comProvides detailed cryptocurrency data, including price, trading volume, and market capitalization.TradingView - tradingview.comFeatures interactive charts, technical analysis tools, and social networking for traders and investors. --s 250

View Limit Reached
Upgrade for premium prompts, full browsing, unlimited bookmarks, and more.
Get Premium
Limit Reached
Upgrade for premium prompts, full browsing, unlimited bookmarks, and more. Create up to 2000 AI images and download up to 3000 monthly
Get Premium
Become a member
Sign up to download HD images, copy & bookmark prompts.
It's absolutely FREE
 Login or Signup with Google

Become a member
Sign up to download HD images, copy & bookmark prompts.
It's absolutely FREE
 Login or Signup with Google

Limit Reached
Upgrade for premium prompts, full browsing, unlimited bookmarks, and more.
Get Premium


 Download Image (SD)
 Download Image (HD)


