


Illustration of Magazine Grid Development Process


 Download Image (SD)
 Download Image (HD)
Share


License
Free to use with a link to 2moonsai.com

Similar Images
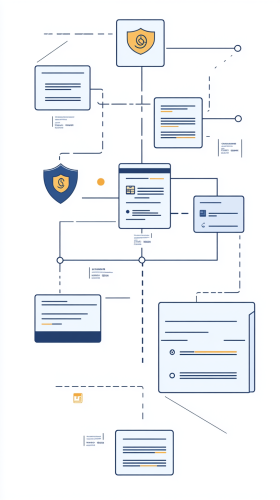


Create a simple, professional flowchart showing the flow of credit card payment data in a financial transaction with a county treasurer. Include three main steps: (1) a customer making a payment with a credit card, (2) a payment processor handling the transaction, and (3) the county treasury receiving the payment. Over each step, display a shield icon to represent security. Use clear, minimalist icons and light blue and gray color tones to convey trust and protection. --ar 9:16

A diagrammatic portrait representation of A diagrammatic portrait illustrating the FizzBuzz challenge. The image shows a flowchart with numbers from 1 to 100, highlighting multiples of 3 with 'Fizz', multiples of 5 with 'Buzz', and multiples of both 3 and 5 with 'FizzBuzz'. The background is predominantly dark blue. --ar 1:1 --quality .5

backdrop light gradient design with light blue on the top and bottom and white in the center, also include some sort of gray perspective grid at the bottom --ar 16:9

This image features a geometric pattern that combines abstract shapes such as circles, triangles, and rectangles. The color scheme primarily consists of vivid pinks, blues, yellows, oranges, and purples. The design is arranged in a grid, with each section containing different combinations of shapes and patterns, such as stripes, solid blocks, and overlapping circles. --ar 16:9
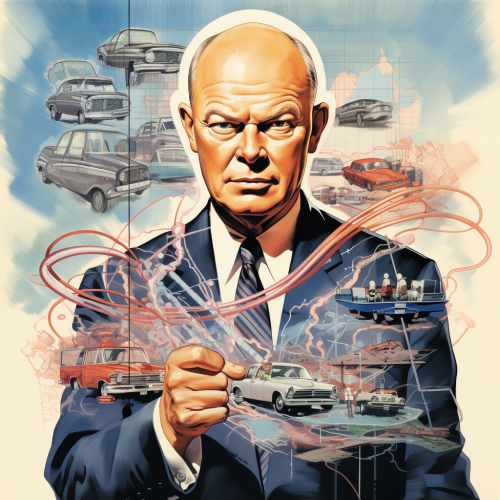
a 1960s style illustration of President Dwight D. Eisenhower with a background of the American interstate highway system, transitioning into a modern electric grid. This visual metaphor draws a parallel between Eisenhower's infrastructure achievements and the contemporary need for electric grid modernization.
Visualize an API flowchart connecting to a Kindle device, with icons representing data extraction, and a subtle binary code background. Emphasize integration and data transfer without any text or words.

grid of app icon to close application, --v 6.0 --stylize 50 --style raw

Michael is a 50-year-old founder of a medium-sized enterprise. He has a basic understanding of technology, but is not well-versed in web development or UX principles. He is entirely new to the process of web development.

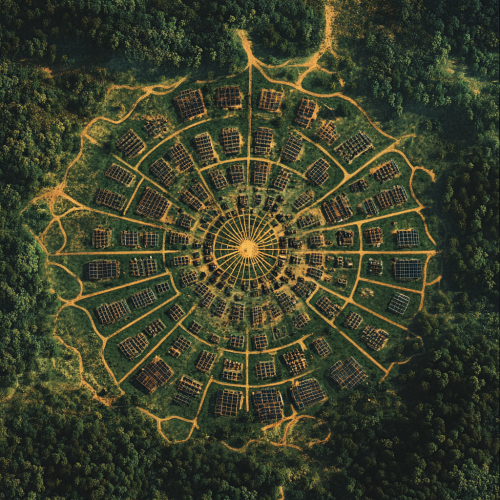
a far away aerial photo straight down on a grid of many huge off-grid solarpunk communities dominated by nature with a lot of forest inbetween them. each community has 12 plots with 10 acres of land, in a mandala formation. Community center in the middle. Surrounded by forest. Most of the plots are covered with foodforest. Houses are at the outskirt of the village and have a lot of space between them, so they looks small in the picture. The plots are separated by trees.

Envision a well-structured flowchart that intricately outlines the process of evaluating and refining employee benefits, fostering an enhanced Functional Operating Capacity (FOC) and uplifting organizational productivity. The flowchart initiates with a broad 'Benefits Evaluation' box that branches into several meticulous analysis paths including 'Data Analytics', 'Employee Feedback', and 'Health Metrics Analysis'. The 'Data Analytics' path delves into scrutinizing the utilization and effectiveness of current benefits, branching further into sub-categories like 'Usage Statistics' and 'Cost-Benefit Analysis'. Simultaneously, the 'Employee Feedback' path unfolds into 'Survey Responses' and 'Focus Groups', aiming to gather qualitative insights on employee satisfaction and perceived value of the benefits provided. The 'Health Metrics Analysis' pathway, on the other hand, zeroes in on evaluating the impact of current benefits on employees' health and Functional Operating Capacity, subdividing further into 'Physical Health Metrics' and 'Psychological Well-being Assessment'. These analysis paths converge into a central point labeled 'Benefits Refinement', signifying the amalgamation of insights derived. From here, a well-defined path named 'Benefits Optimization' emanates, symbolizing the iterative process of tweaking the benefits scheme based on gathered data to better cater to employee health and wellness needs. This section opens up to show various refined benefits like 'Improved Healthcare Coverage', 'Fitness Stipends', 'Mental Health Support', and 'Flexible Work Arrangements'. Finally, the flowchart culminates in a box labeled 'Enhanced Functional Operating Capacity & Organizational Productivity', illustrating the ultimate goal of this rigorous analysis and [...]

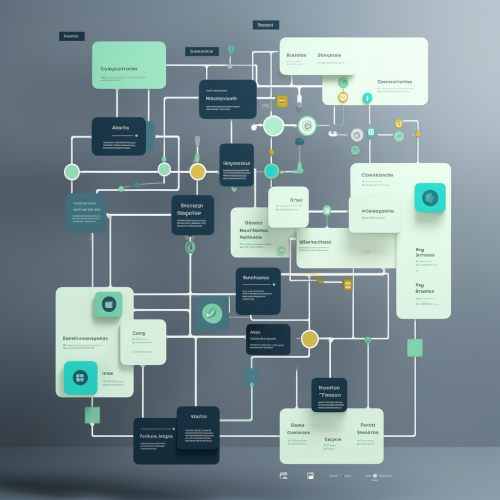
Create a sleek, modern decision flowchart with smooth lines and geometric shapes, using vibrant gradients and minimalist icons. The design should be in a flat, vector art style with a clean drak blue background, showcasing interconnected pathways in a visually engaging way.


an illustration for "grid application" during a solar installing process. orange colours and dark outlines

View Limit Reached
Upgrade for premium prompts, full browsing, unlimited bookmarks, and more.
Get Premium
Limit Reached
Upgrade for premium prompts, full browsing, unlimited bookmarks, and more. Create up to 2000 AI images and download up to 3000 monthly
Get Premium
Become a member
Sign up to download HD images, copy & bookmark prompts.
It's absolutely FREE
 Login or Signup with Google
Become a member
Sign up to download HD images, copy & bookmark prompts.
It's absolutely FREE
Login or Signup with Google
Limit Reached
Upgrade for premium prompts, full browsing, unlimited bookmarks, and more.
Get Premium