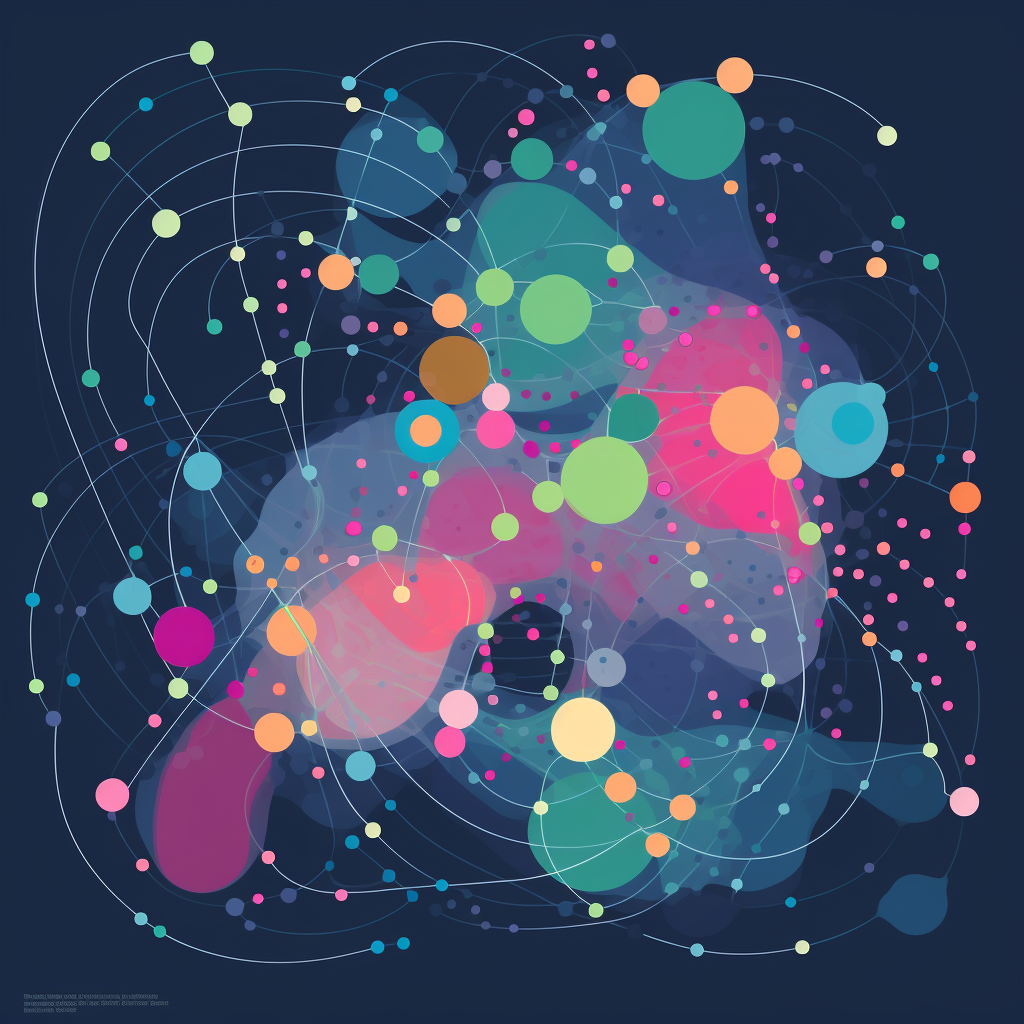
Colorful interconnected data points map
Prompt
License
Free to use with a link to 2moonsai.com
Similar Images
a workspace setup with a detailed topographic map spread on a table below. This scene emphasizes the interplay between temporal and spatial scales. Embedded within the map, place contrasting annotations or overlays: one zone showcasing averaged or 'lumped' data and another showing intricate, 'distributed' data points. --ar 21:9
network of interconnected nodes with secure connections. --s 750 --v 6.0
Above the tranquil sea, three clusters of boats form a visually pleasing arrangement; red boats to the west, green to the east, and blue to the south. Mysteriously, traces of a neural network with nodes appear, connecting each boat group, symbolizing interconnected data streams; white background, drone, from above, unreal engine, cinematic lightning, hyper realistic, minimalistic, --ar 3:2 --s 750 --v 4
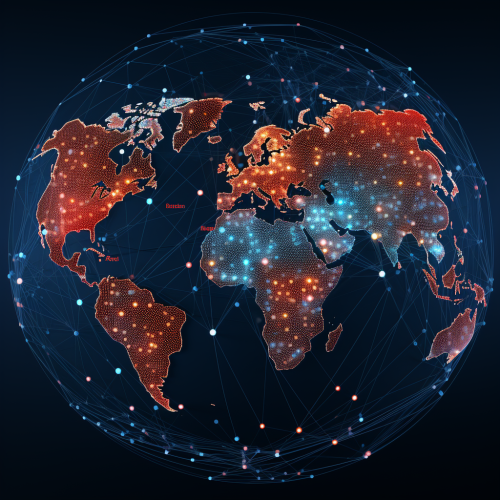
Businessman touching global network connection and data exchanges on internet network and digital software development, Algorithm and data science. social networking and communication.
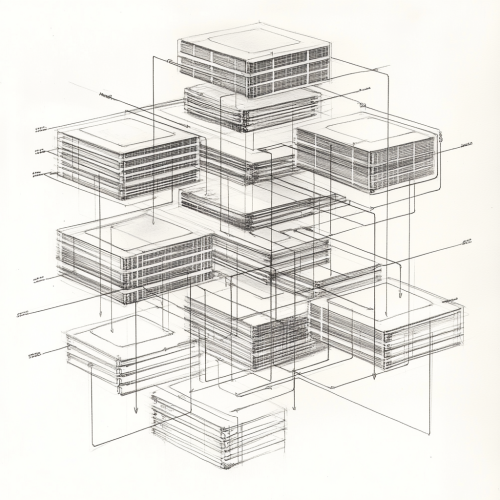
Detailed pencil sketch of interconnected databases on a solid white background. The sketch features multiple rectangular database tables with visible columns and rows, linked by fine lines to represent data connections. Each table is shaded lightly with precise, technical detailing, and arrows indicate data flow between them. The overall style is minimalist and clean, emphasizing the organized structure and connectivity of the databases against the plain, white backdrop.
Abstract Data Patterns that resembles data patterns, such as interconnected dots, lines, or neural network-like visuals --s 750 --style raw
an learning journey visualised as a map with points along the way. the points are stars that are filled to indicate completion. the journey is set through a forest. The path does not cross each other. There are litter rivers, water falls, trees and mountains on the map.
Create an extremely simple line icon illustration representing data sources, with clean lines and minimal design, black line on white background --s 250
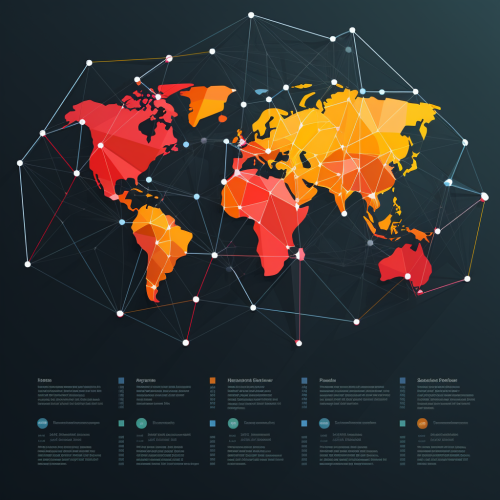
information graphic for a financial trading and data company. the idea is for a geographic outline of a flat world map covered with pronounced lines and visible webs connecting different points to each other. the connections are data points which show that the entire world is trading with each other. show the entire world is connected through a web of trading centers. Use hex color codes #063151, #8EA6C4, and #FFFFFF.
Design a visual representation of an AI assistant analyzing customer reviews, extracting key data points like date, product, rating, summary, action items, competitor mentions, and sentiment. The scene should emphasize clarity, precision, and efficiency in data processing, reflecting the AI's role in enhancing business decisions. Minimalist, crisp white background, no grunge, splash, dust --ar 16:9 --v 6.1
GDPR as a something easy and as importance as the huamn wrights

View Limit Reached
Upgrade for premium prompts, full browsing, unlimited bookmarks, and more.
Get Premium
Limit Reached
Upgrade for premium prompts, full browsing, unlimited bookmarks, and more. Create up to 2000 AI images and download up to 3000 monthly
Get Premium
Become a member
Sign up to download HD images, copy & bookmark prompts.
It's absolutely FREE
 Login or Signup with Google

Become a member
Sign up to download HD images, copy & bookmark prompts.
It's absolutely FREE
 Login or Signup with Google

Limit Reached
Upgrade for premium prompts, full browsing, unlimited bookmarks, and more.
Get Premium




 Download Image (SD)
 Download Image (HD)


