


Infographic on Energy Demand and Balanced Diet


 Download Image (SD)
 Download Image (HD)
Share


License
Free to use with a link to 2moonsai.com

Similar Images
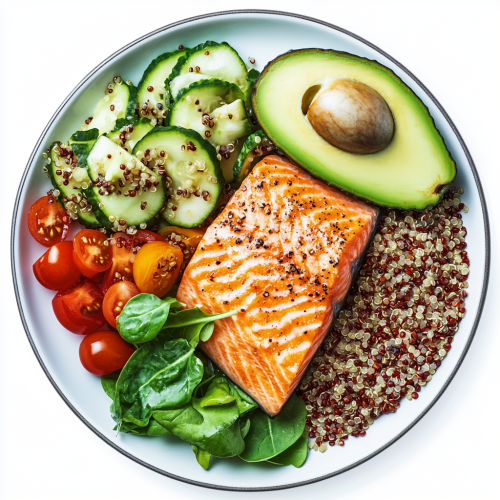


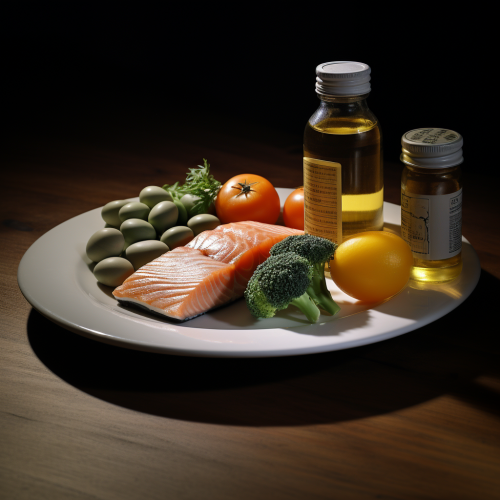
A neatly divided plate showing balanced portions of protein (grilled salmon), healthy fats (avocado), and complex carbohydrates (quinoa and vegetables). Each portion is visually distinct, with vibrant colors to emphasize the importance of variety and balance in a healthy diet.
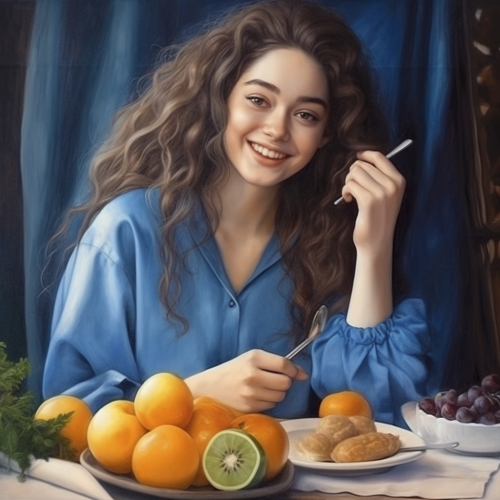
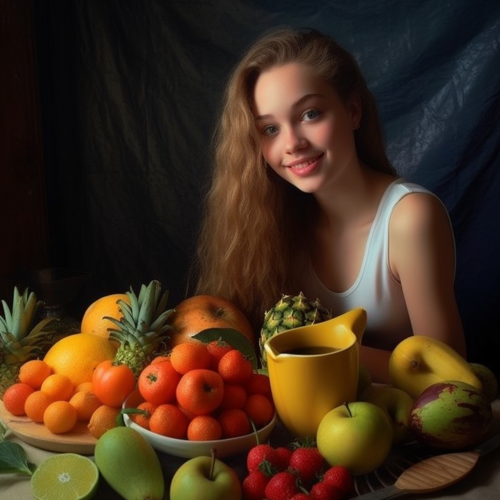
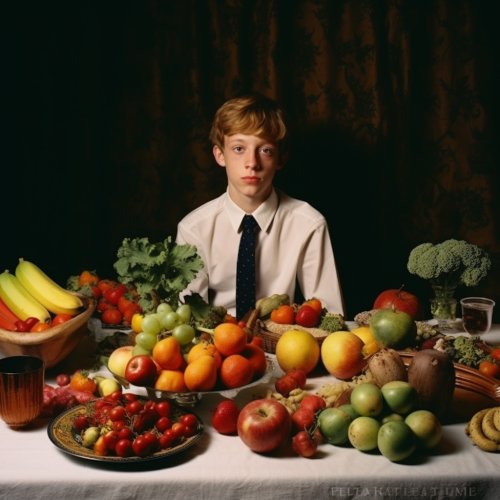
style dessin une belle adolescente en robe bleue avec un grand sourire heureuse de manger un repas équilibré avec des fruits, des légumes, du fromage et du pain --v 5.1 --s 750

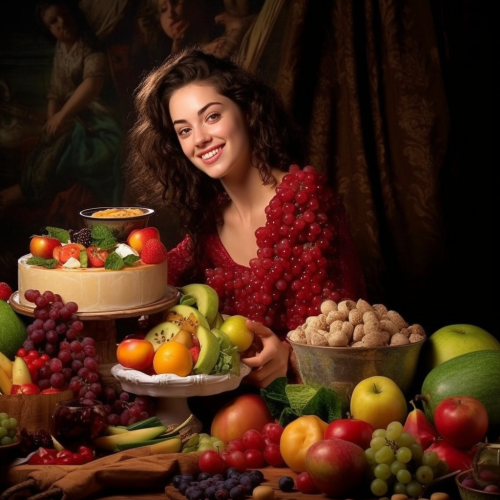
une belle adolescente avec un grand sourire heureuse de manger un repas équilibré avec des fruits, des légumes, du fromage et du pain --v 5.1 --s 750
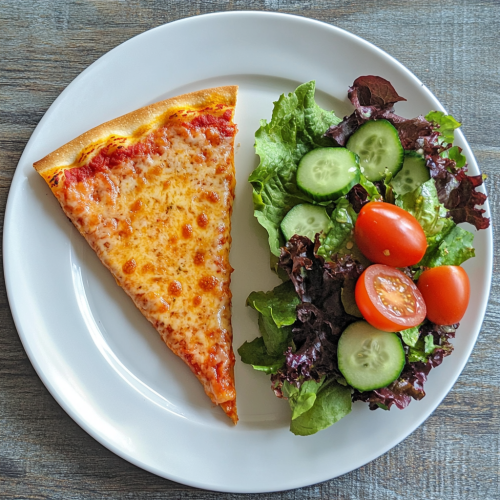
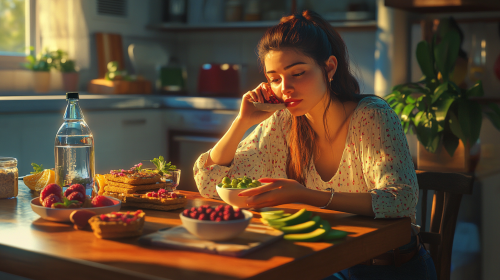
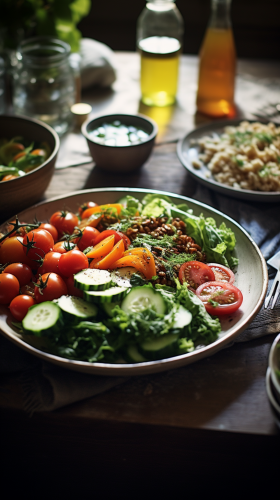
A single slice of pizza on a white plate, served alongside a healthy salad made of leafy greens, tomatoes, and cucumbers. The image conveys the message that indulgences can fit into a healthy diet when balanced with nutritious choices.


a healthy breakfast with oatmeal, bluebarries, nuts, and a black coffee
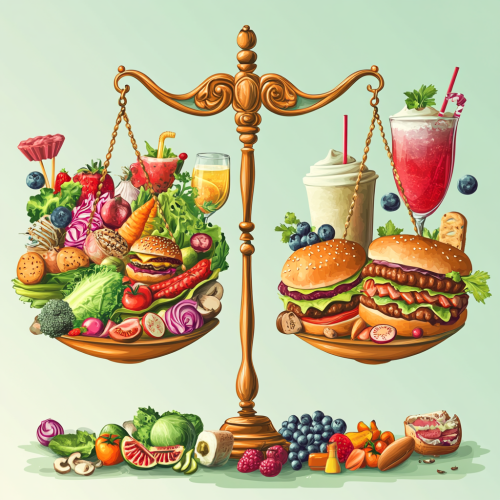
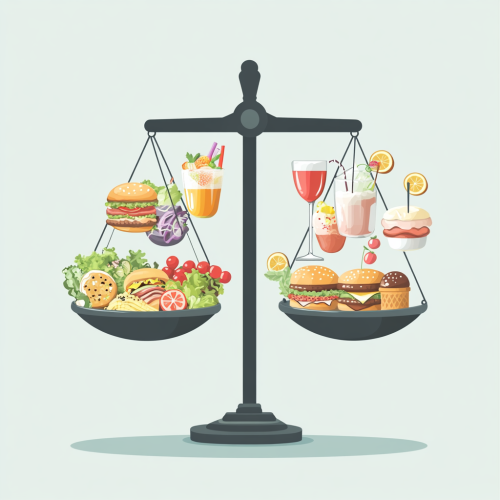
Symmertrical weighing balance with 2 sides - one side loaded with healthly items ( salad, vegetables, fruits) and the other side loaded with indulgences( burgers, hot dogs, ice-cream, cocktails, wine glass.); done in vector style and bright pastel colors
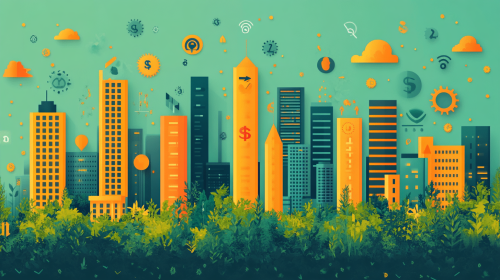
Infographic on Projected Growth of the Carbon Market: A bar chart or line graph that shows the growth trajectory of the carbon credit market from the present to 2050. Use a contrasting color to highlight your company’s projected share or position in the market, alongside supportive icons like dollar signs or green energy symbols to emphasize growth and opportunity --ar 16:9 --stylize 1000
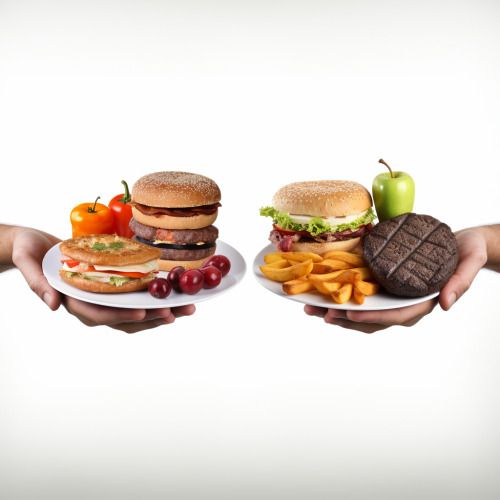
make an image of people holding two plates and comparing them, one plate must contain exclusively vegetables, fruits and vegetables and the other plate must contain exclusively bad foods such as hamburgers, fries, sweets, with a white background
View Limit Reached
Upgrade for premium prompts, full browsing, unlimited bookmarks, and more.
Get Premium
Limit Reached
Upgrade for premium prompts, full browsing, unlimited bookmarks, and more. Create up to 2000 AI images and download up to 3000 monthly
Get Premium
Become a member
Sign up to download HD images, copy & bookmark prompts.
It's absolutely FREE
 Login or Signup with Google
Become a member
Sign up to download HD images, copy & bookmark prompts.
It's absolutely FREE
Login or Signup with Google
Limit Reached
Upgrade for premium prompts, full browsing, unlimited bookmarks, and more.
Get Premium