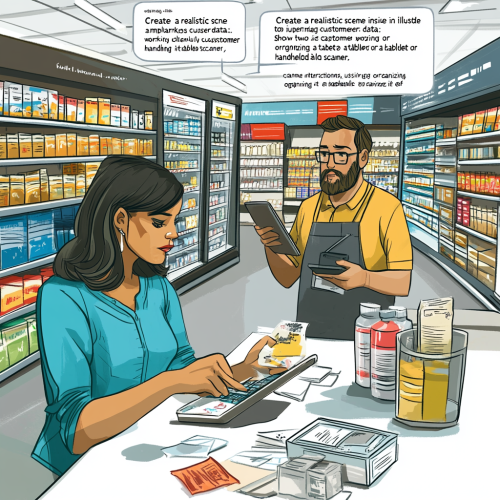
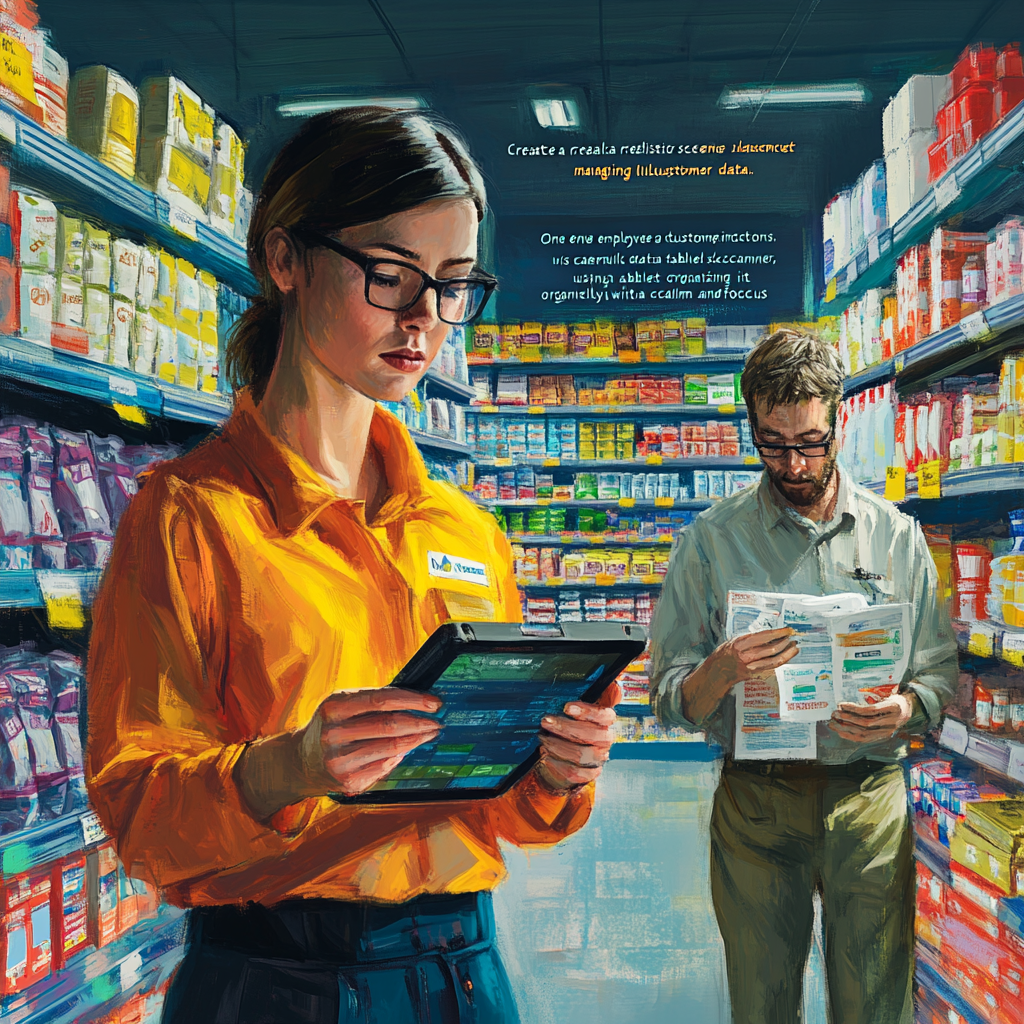
Employee Organizing Customer Data in Supermarket Scene
License
Free to use with a link to 2moonsai.com
Similar Images
Three icons representing (1) data-centric approach that is a blue data icon, (2) strategic planning that is a green bullseye icon, and (3) customer satisfaction that is a yellow thumbs-up icon. Transparent background
"Create an image that illustrates the challenges of managing customer data in business. Show a chaotic scene where data is scattered everywhere, represented as glowing symbols or data streams floating in the air. One person is carefully collecting the data and organizing it into useful insights, using a digital CRM system displayed on a screen. Nearby, another person is overwhelmed, gathering too much data but confused, unable to make sense of it. Highlight the contrast between effective data utilization with strategic insight and the frustration of handling too much unstructured information without a clear plan."
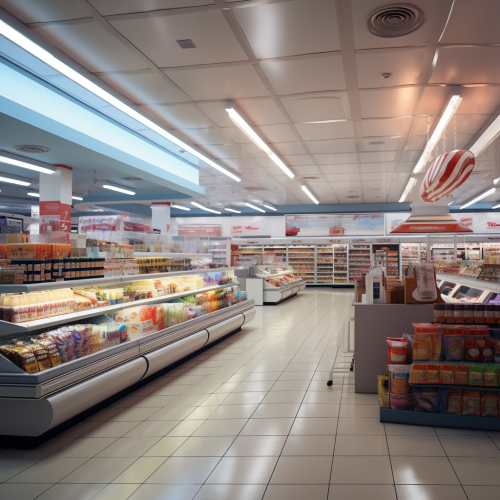
ultra realistic photo, high definition, colorful background, of the interior of a supermarket
a photo, Precise employee benefits, data-driven welfare strategy, cost-effective balance, targeted benefit policy, reduce unnecessary expenses, enhance attractiveness of benefits, improve employee satisfaction, positive company perception, with light pink background
a retail employee taking feedback notes from customers --ar 4:3 --s 250
concept image of digital data, analytics, customer data lists, artificial intelligence, hyper realistic photography, detailed cinematic, 32k --ar 16:9
abstract banner image, concept of digital data, analytics, customer data lists, artificial intelligence, hyper realistic photography, detailed cinematic, 32k --ar 16:9
interior design of healthy food department in a supermarket, which consists of organic flour, cereals, drinks on a high rack 1.9 meters high, healthy food products such as cereals, muesli, bars are placed on the rack, the aisle distance from one rack to the second one and a half meters, eco-friendly style, emphasize the naturalness of products with the interior design of this department, add visual communication with a focus on health, minimalist style with elements of nature and organic --style raw --s 250
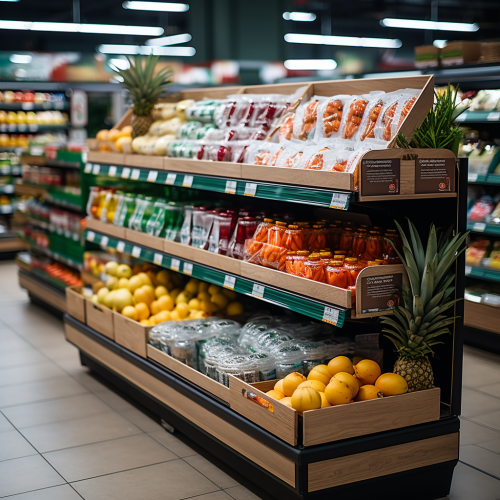
a large american supermarket corridor full of pricetags and products, photorealistic
black and white vector image, infographic style image of a computer performing a smart analysis over a customer account, no shadows, no background, no boarders --v 6.0
abstract banner image, data analytics, customer data lists, artificial intelligence, hyper realistic photography, detailed cinematic, 32k --ar 16:9

View Limit Reached
Upgrade for premium prompts, full browsing, unlimited bookmarks, and more.
Get Premium
Limit Reached
Upgrade for premium prompts, full browsing, unlimited bookmarks, and more. Create up to 2000 AI images and download up to 3000 monthly
Get Premium
Become a member
Sign up to download HD images, copy & bookmark prompts.
It's absolutely FREE
 Login or Signup with Google

Become a member
Sign up to download HD images, copy & bookmark prompts.
It's absolutely FREE
 Login or Signup with Google

Limit Reached
Upgrade for premium prompts, full browsing, unlimited bookmarks, and more.
Get Premium




 Download Image (SD)
 Download Image (HD)


