


Ecological infographic with bar graph and text sections


 Download Image (SD)
 Download Image (HD)
Share


License
Free to use with a link to 2moonsai.com

Similar Images
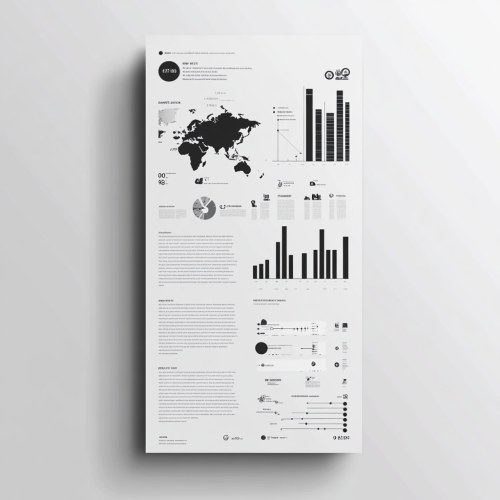


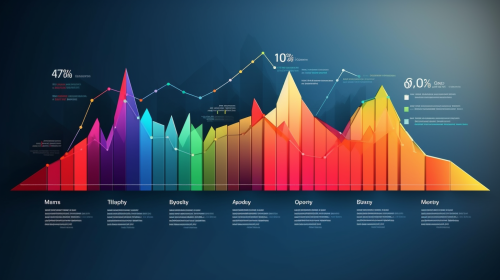
Infographic on Projected Growth of the Carbon Market: A bar chart or line graph that shows the growth trajectory of the carbon credit market from the present to 2050. Use a contrasting color to highlight your company’s projected share or position in the market, alongside supportive icons like dollar signs or green energy symbols to emphasize growth and opportunity --ar 16:9 --stylize 1000
limoncello confectionery and cosmetological bar logo template on white background, in the style of intricate and delicate line work, #screenshotsaturday, quirky expressions, bloomsbury group, enchanting watercolors, monochromatic color schemes, rustic simplicity --v 6.0
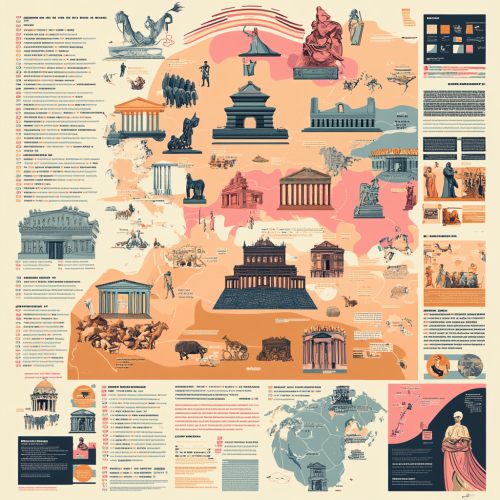
Illustrated map-like infographic highlighting the rise and fall of major civilizations (e.g., Ancient Greece, Roman Empire, Chinese dynasties), social/political movements (e.g., revolutions, reforms), and the evolution of cultural practices (e.g., art, music, literature), using a rich, historical color palette. Include stylized icons, timelines, and regional illustrations. The page is filled with one main object and additional details around it. Color palette of pink, orange and blue --v 6.1 --style raw
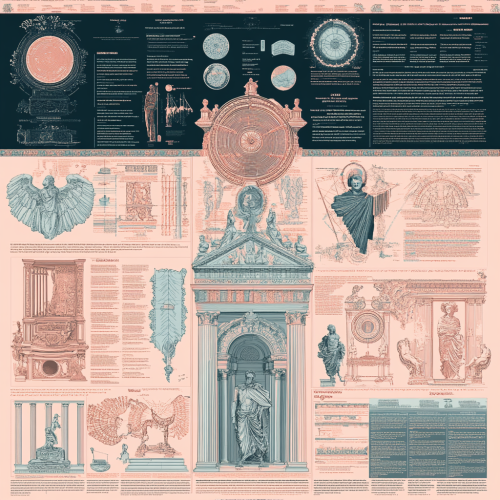
infographic about art cycles during the ages. The artwork features multiple panels that showcase detailed line work of different artists and cultures, scales, and other intricate details. Aesthetic combines classical serenity with dynamic data chaos, illustrating tradition meeting innovation. The page is filled with one main object and around it there are additional detailes about it. Colorful. Color palette pink and cyan --v 6.1 --style raw

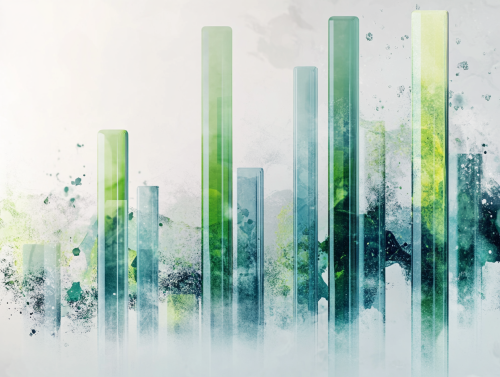
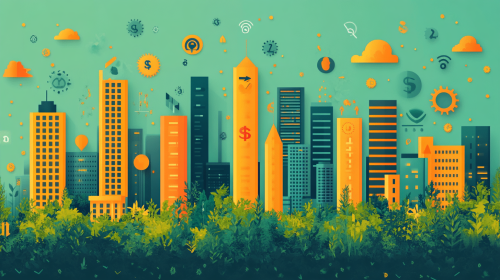
Generate a digital art for A digital art scene showcasing a dynamic bar graph with upward trends, representing increased revenue over time. The background is a soft light gray color, with vibrant colors like green and blue for the bars. The scene is modern and sleek, emphasizing growth and success. --ar 4:3
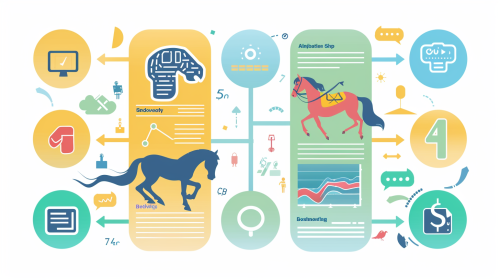
A flat modern infographic showing all four steps of the automatic horse betting purchase process. Step 1: AI brain processes horse racing data. Step 2: CSV file export with racing symbols. Step 3: Data is uploaded to an automated trading system via a computer or cloud. Step 4: Automatic horse betting ticket with a checkmark. Each step is connected by bold arrows from left to right. Light pastel colors (blue, green, yellow) with clear icons, minimalistic yet detailed design, professional layout, hd quality --ar 16:9 --v 6.0
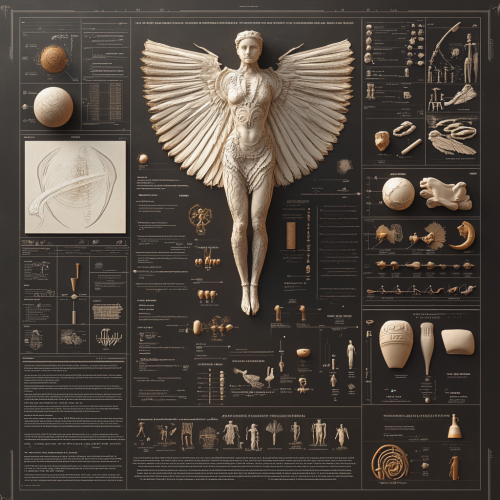
Creative infographic of art in prehistoric age. The page is filled with one main object and around it there are multiple panels that showcase detailed line work of different artists and cultures, scales, and other intricate details. Aesthetic combines classical serenity with dynamic data chaos, illustrating tradition meeting innovation. Contrast, richness in detail. 3D render, octane, cinema4d --v 6.1 --style raw
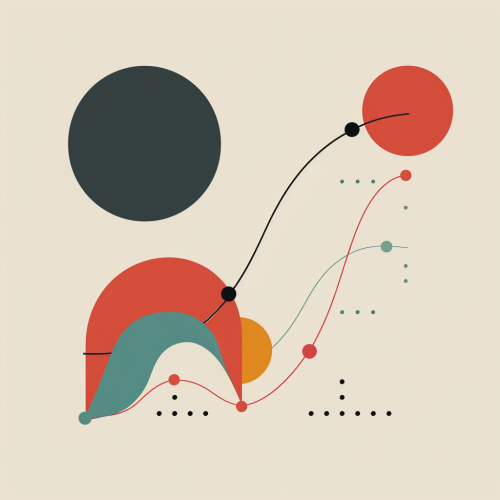
A stylized line graph with an upward trend, symbolizing growth and progress.
Eco friendly abstract graphic design Banner Pattern background template --ar 2:1 --style raw --stylize 50 --v 6.0

green, minimalist favicon for a habit tracker app consisting of a bar graph which starts at 0 and grows exponentially
green, minimalist favicon for a habit tracker app depicting an increasing bar graph
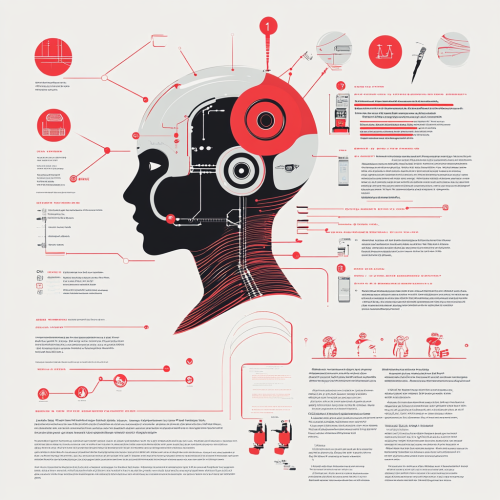
Design a clean, visually engaging infographic that compares the differences between Generative AI, AI, MLP (Multilayer Perceptron), and LLM (Large Language Models) on a white background with cherry red (#d32f2f) as the primary accent color. Each section should briefly define each technology and list platforms that use it. Use retro-inspired, 1950s mid-century advertising art style with bold typography, simple icons, and clear sections. Incorporate stylized illustrations such as vintage robots for AI, neural networks for MLP, speech bubbles or text for LLM, and creative elements like brushes or pens for Generative AI. Ensure the infographic has a balanced, organized layout with clear headings and a nostalgic, but modern feel. Breakdown of Sections: 1. Artificial Intelligence (AI): • Definition: Broad field of computer science focused on building systems capable of performing tasks that require human intelligence. • Platforms: Google Assistant, Siri, Tesla Autopilot, Salesforce Einstein 2. Generative AI: • Definition: AI that creates new content such as text, images, video, and audio by learning from existing data patterns. • Platforms: ChatGPT, DALL-E 2, MidJourney, Jasper AI, RunwayML 3. MLP (Multilayer Perceptron): • Definition: A type of neural network with multiple layers used for tasks like classification and regression. • Platforms: TensorFlow, PyTorch, Keras, Azure Machine Learning, IBM Watson Studio 4. LLM (Large Language Models): • Definition: Large models trained on massive datasets of text to perform language-based tasks like text generation and translation. • Platforms: GPT-4 (OpenAI), BERT (Google), Claude (Anthropic), BLOOM, Microsoft Azure
View Limit Reached
Upgrade for premium prompts, full browsing, unlimited bookmarks, and more.
Get Premium
Limit Reached
Upgrade for premium prompts, full browsing, unlimited bookmarks, and more. Create up to 2000 AI images and download up to 3000 monthly
Get Premium
Become a member
Sign up to download HD images, copy & bookmark prompts.
It's absolutely FREE
 Login or Signup with Google
Become a member
Sign up to download HD images, copy & bookmark prompts.
It's absolutely FREE
Login or Signup with Google
Limit Reached
Upgrade for premium prompts, full browsing, unlimited bookmarks, and more.
Get Premium