


Data graphics with information and numbers
Prompt
A large screen with tons of data, graphics, informations, numbers and character --s 750


 Download Image (SD)
 Download Image (HD)
Share


License
Free to use with a link to 2moonsai.com

Similar Images

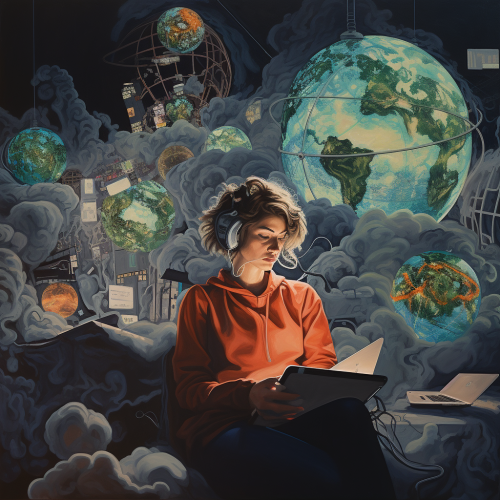
a flow of information represented both as a moving flow and also as a static observable object


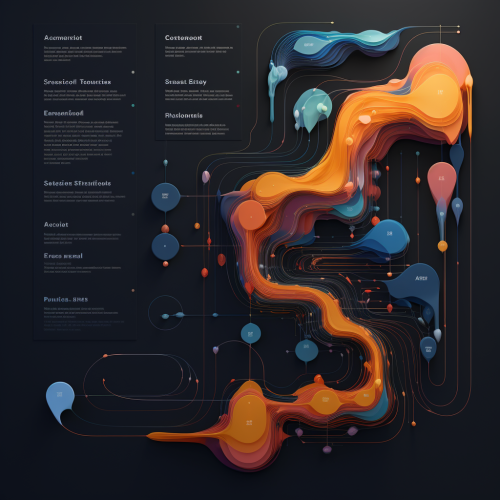
Abstract Data Patterns that resembles data patterns, such as interconnected dots, lines, or neural network-like visuals --s 750 --style raw

logo minimalist for visualization architetonic with lines, simple, hd ,background white,

information security team of central bank of azerbaijan


A consumer touches the tablet, which displays information about an electric vehicle, including the model and the scheduled time for the test drive. This interactive feature allows the consumer to easily access important details and confirm their appointment, enhancing the overall experience at the dealership.


micro computer information flow data visualization on a microchip as if the microchip is roadways of an ultra vibrant modern cityscape accented with neon LED lighting --ar 7:4 --v 6.0

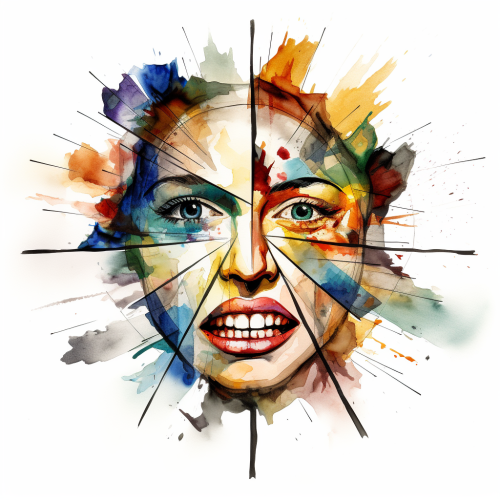
Imagine an image of a human face divided into several sections, each section representing a different emotion such as happiness, sadness, anger, fear, surprise, and disgust. Inside each section, there could be various facial expressions and body language cues associated with that emotion. The image could also include arrows or lines connecting these sections to a central area, symbolizing the idea that emotional intelligence involves the ability to recognize, understand, and manage these emotions, both within oneself and in others. Additionally, you could add elements like a brain with thought bubbles connecting to each emotion, illustrating the cognitive aspect of emotional intelligence, where one understands the underlying thoughts and reasons behind emotions. This image would visually represent the concept of emotional intelligence, emphasizing the importance of recognizing and managing emotions for better interpersonal relationships and self-awareness.

computer screen displaying colorful charts and tables, photo realistic --style raw --ar 16:9 --v 5.2


View Limit Reached
Upgrade for premium prompts, full browsing, unlimited bookmarks, and more.
Get Premium
Limit Reached
Upgrade for premium prompts, full browsing, unlimited bookmarks, and more. Create up to 2000 AI images and download up to 3000 monthly
Get Premium
Become a member
Sign up to download HD images, copy & bookmark prompts.
It's absolutely FREE
 Login or Signup with Google
Become a member
Sign up to download HD images, copy & bookmark prompts.
It's absolutely FREE
Login or Signup with Google
Limit Reached
Upgrade for premium prompts, full browsing, unlimited bookmarks, and more.
Get Premium