


API Flowchart Kindle Data Extraction Icons
Prompt
Visualize an API flowchart connecting to a Kindle device, with icons representing data extraction, and a subtle binary code background. Emphasize integration and data transfer without any text or words.


 Download Image (SD)
 Download Image (HD)
Share
License
Free to use with a link to 2moonsai.com

Similar Images
An early 1980s computer terminal screen aesthetic, with green or amber text on a black background. Displays financial graphs, data points, and small icons representing AI, machine learning, and automation. Use a vintage computer font with modern data elements for a 'terminal-style' look, merging retro computing with a focus on finance and automation expertise. Minimalistic, nostalgic, and tech-oriented. --v 6.1 --ar 16:9 --q 2

Hyper-realistic. Blue/purple theme. Ultra detailed. OCR Text Labeling: Driving Document Automation and Data Extraction --ar 16:9
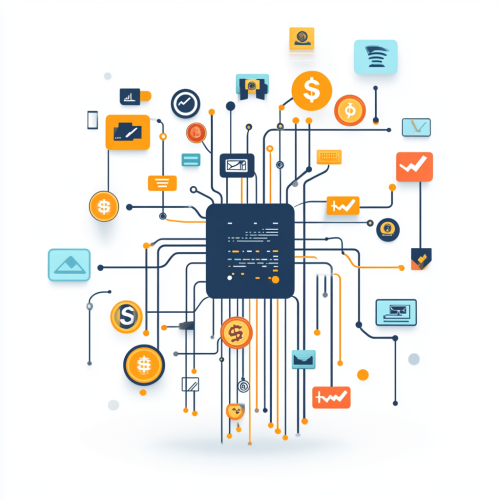
modern illustration on a white background featuring a central futuristic API server with luminous circuits and data connections extending outward. The server is surrounded by floating financial icons, such as coins, message bubbles, bank transfer symbols, and transaction icons. These elements appear to be carried along by the server's glowing connections, symbolizing the seamless management of financial data and transactions. The design is minimalist, with a focus on fintech innovation, digital finance, and the flow of data in financial services, white background, dramatic, zoomed.

photorealistic image of a professional female individual in a data center, smiling and surrounded by comprehensive application protection, bot, API protection, protection, DDoS, tailored shirt, ID
Create an extremely simple line icon illustration representing data sources, with clean lines and minimal design, black line on white background --s 250
A minimalistic vector illustration of secure data flow, featuring digital devices connected through a secure network, with locked icons representing protection. Soft baby blue gradients in the background, simple shapes, and clean lines. The design emphasizes the security of data even when it leaves the company. Created Using: flat vector illustration, baby blue gradient, soft shapes, minimalism, clean lines, modern design, abstract elements, digital security --ar 16:9 --v 6.0

A stream of interconnected hexagons flowing from one end to another. It can symbolize the flow of data and communication in a REST API. --ar 3:2
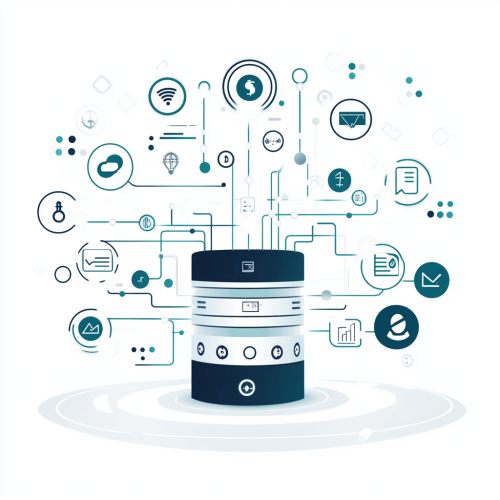
A clean, modern illustration on a white background featuring a central futuristic API server with luminous circuits and data connections extending outward. The server is surrounded by floating financial icons, such as coins, message bubbles, bank transfer symbols, and transaction icons. These elements appear to be carried along by the server's glowing connections, symbolizing the seamless management of financial data and transactions. The design is minimalist, with a focus on fintech innovation, digital finance, and the flow of data in financial services, white background.

A stream of interconnected hexagons flowing from one end to another. It can symbolize the flow of data and communication in a REST API.
Three icons representing (1) data-centric approach that is a blue data icon, (2) strategic planning that is a green bullseye icon, and (3) customer satisfaction that is a yellow thumbs-up icon. Transparent background
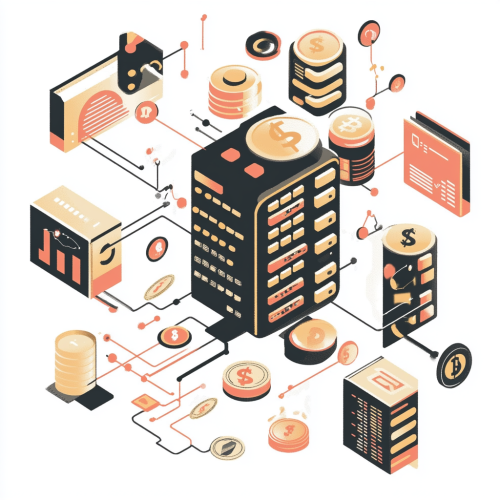
illustration of an API Server working in finance, mesaages, coins aound it depicts as it was carying these elements where it goes, white background, fintech, fiancne
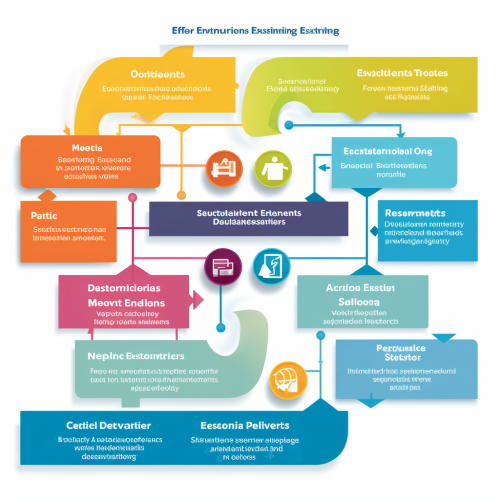
Envision a well-structured flowchart that intricately outlines the process of evaluating and refining employee benefits, fostering an enhanced Functional Operating Capacity (FOC) and uplifting organizational productivity. The flowchart initiates with a broad 'Benefits Evaluation' box that branches into several meticulous analysis paths including 'Data Analytics', 'Employee Feedback', and 'Health Metrics Analysis'. The 'Data Analytics' path delves into scrutinizing the utilization and effectiveness of current benefits, branching further into sub-categories like 'Usage Statistics' and 'Cost-Benefit Analysis'. Simultaneously, the 'Employee Feedback' path unfolds into 'Survey Responses' and 'Focus Groups', aiming to gather qualitative insights on employee satisfaction and perceived value of the benefits provided. The 'Health Metrics Analysis' pathway, on the other hand, zeroes in on evaluating the impact of current benefits on employees' health and Functional Operating Capacity, subdividing further into 'Physical Health Metrics' and 'Psychological Well-being Assessment'. These analysis paths converge into a central point labeled 'Benefits Refinement', signifying the amalgamation of insights derived. From here, a well-defined path named 'Benefits Optimization' emanates, symbolizing the iterative process of tweaking the benefits scheme based on gathered data to better cater to employee health and wellness needs. This section opens up to show various refined benefits like 'Improved Healthcare Coverage', 'Fitness Stipends', 'Mental Health Support', and 'Flexible Work Arrangements'. Finally, the flowchart culminates in a box labeled 'Enhanced Functional Operating Capacity & Organizational Productivity', illustrating the ultimate goal of this rigorous analysis and [...]
a user interface in a computer in light green and blue tones, with holographic icons, a secure layout, and organized data streams, conveying data protection, minimalism, and an advanced, technology-driven atmosphere
Scenic mountain landscape with a subtle overlay of data lines and holographic icons, showing trail data and eco-footprint markers, soft integration of digital visuals into the natural scenery, minimalist yet informative --ar 16:9 --v 6.1

Data Appropriation, focus on a large magnet pulling user icons and personal data from a cloud storage symbol, setting is a digital landscape with flowing streams of code, atmosphere of aggressive extraction, Illustration, digital vector art with high contrast and bold lines, --ar 16:9 --v 5.2

View Limit Reached
Upgrade for premium prompts, full browsing, unlimited bookmarks, and more.
Get Premium
Limit Reached
Upgrade for premium prompts, full browsing, unlimited bookmarks, and more. Create up to 2000 AI images and download up to 3000 monthly
Get Premium
Become a member
Sign up to download HD images, copy & bookmark prompts.
It's absolutely FREE
 Login or Signup with Google
Become a member
Sign up to download HD images, copy & bookmark prompts.
It's absolutely FREE
Login or Signup with Google
Limit Reached
Upgrade for premium prompts, full browsing, unlimited bookmarks, and more.
Get Premium