


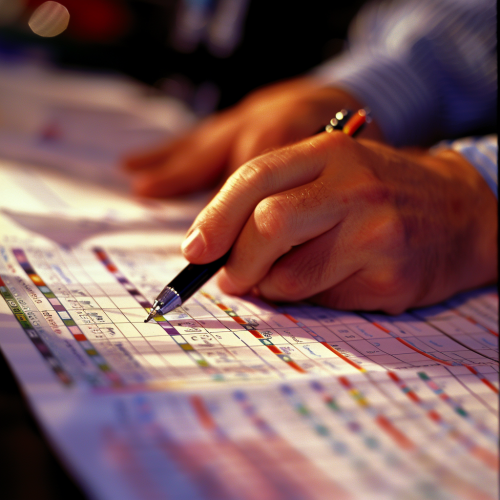
4. Image showing data analysis process
Prompt
analyzing data


 Download Image (SD)
 Download Image (HD)
Share


License
Free to use with a link to 2moonsai.com

Similar Images
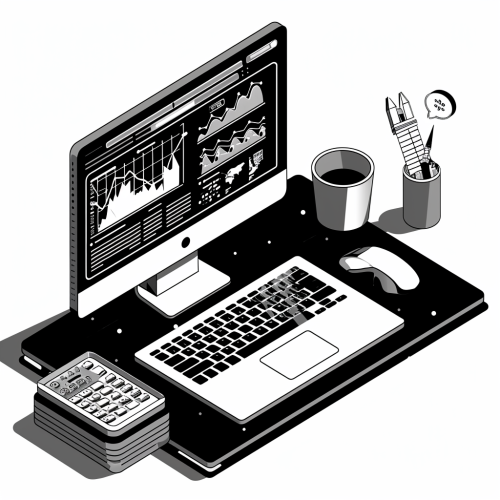
black and white vector image, infographic style image of a computer performing a smart analysis over a customer account, no shadows, no background, no boarders --v 6.0


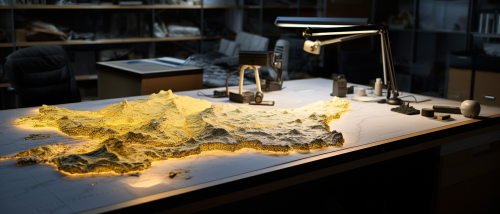
a workspace setup with a detailed topographic map spread on a table below. This scene emphasizes the interplay between temporal and spatial scales. Embedded within the map, place contrasting annotations or overlays: one zone showcasing averaged or 'lumped' data and another showing intricate, 'distributed' data points. --ar 21:9

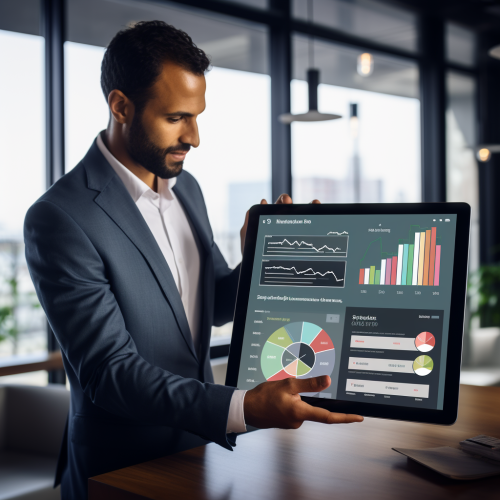
a futuristic auditor studying lots of data with a side profile that leverages generative ai - hyper realism and show multiple races
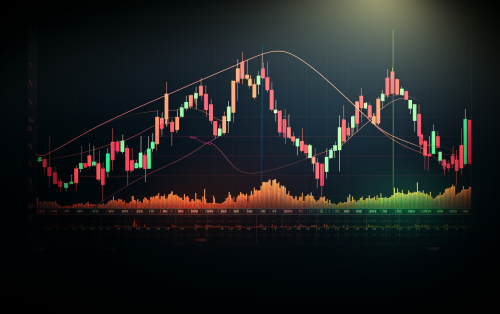
FTX crypto exchange data trading funds analysis technical --ar 16:10

A glowing point where all lines of data converges in the color orange , spot image, pitch black background, realistic, photography, black background --v 6.1


illustration, business man looking at data, smart dress, light blue-grey, dark grey, red, sharp illustration, dark gouache, Illustration in the style of artgerm and charlie bowater and atey ghailan and mike mignola, perfect shading --v 6.0 --s 250
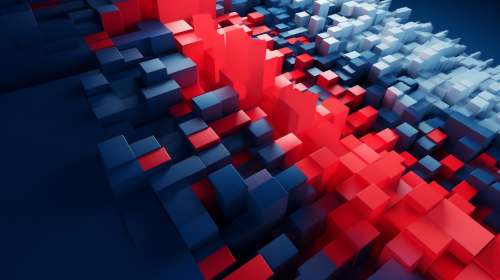
wallpaper render, most part white, geometric devided with deep blue and red, flat image, data analysis elements, 8k --ar 16:9 --v 5.0

data analysis in the sky, lots of numbers, one of the numbers is glowing brighter than the rest

A futuristic, holographic interface displaying dynamic graphs, charts, and equations, with a hand reaching out to interact, symbolizing innovation, technology, and the future of data analysis and decision-making. Art Style: Futuristic Data Visualization --v 6.0
View Limit Reached
Upgrade for premium prompts, full browsing, unlimited bookmarks, and more.
Get Premium
Limit Reached
Upgrade for premium prompts, full browsing, unlimited bookmarks, and more. Create up to 2000 AI images and download up to 3000 monthly
Get Premium
Become a member
Sign up to download HD images, copy & bookmark prompts.
It's absolutely FREE
 Login or Signup with Google
Become a member
Sign up to download HD images, copy & bookmark prompts.
It's absolutely FREE
Login or Signup with Google
Limit Reached
Upgrade for premium prompts, full browsing, unlimited bookmarks, and more.
Get Premium