


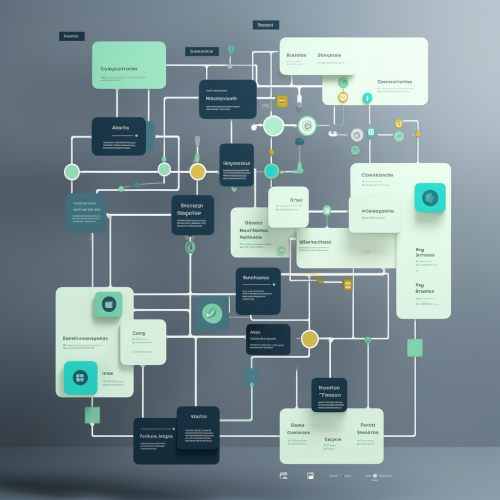
A Modern, Sleak Decision Flowchart with Vibrant Gradients
Prompt
Create a sleek, modern decision flowchart with smooth lines and geometric shapes, using vibrant gradients and minimalist icons. The design should be in a flat, vector art style with a clean drak blue background, showcasing interconnected pathways in a visually engaging way.


 Download Image (SD)
 Download Image (HD)
Share


License
Free to use with a link to 2moonsai.com

Similar Images
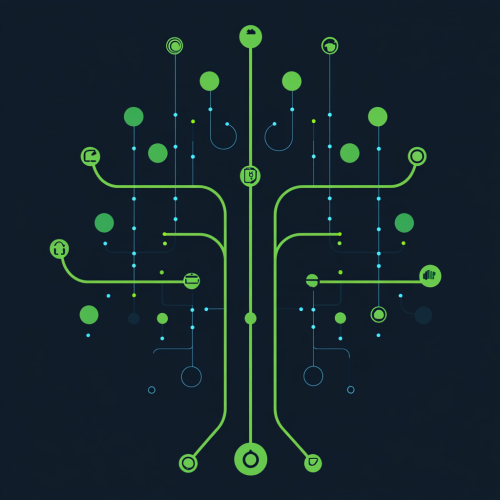
Design a visual representation of a decision tree. The tree should have multiple branching nodes, each representing a decision point, with labeled connections leading to further choices or outcomes. The layout should be clean, organized, and visually intuitive, starting from a central 'decision' node and expanding outward into different possible paths. Each branch should have clear labels for decisions or conditions, leading to outcomes that show potential results. The overall design should be modern, with a professional and clean aesthetic, avoiding the look of an actual tree. 2 colors bright green and bright blue. solid background dark blue. 8k
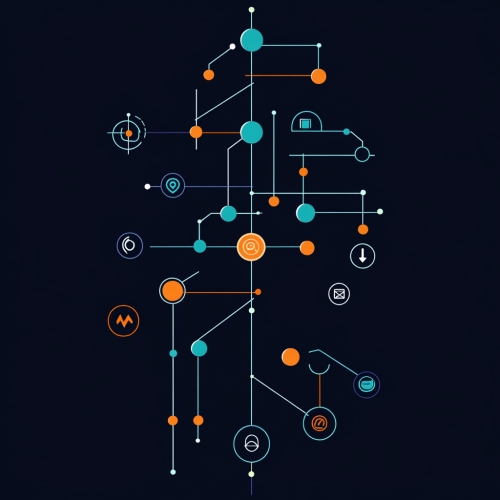
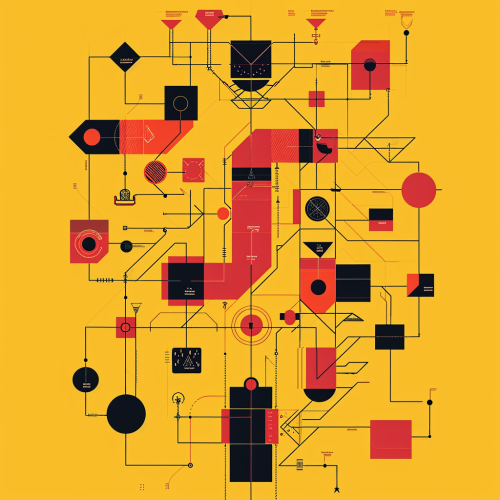
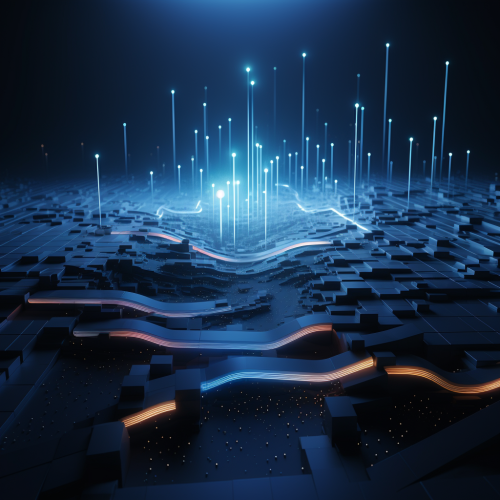
Create a sleek, modern decision model, using vector and minimalist icons. The design should be in a flat, vector art style with a clean drak blue background, showcasing interconnected pathways in a visually engaging way. each decision is a line, each node is divided into two or 3 lines. 8k
an icon of an umbrella that includes 3d icons gradiants of blue and white some digital shadows that feels modern minimal and a hint of future tech with no background white background
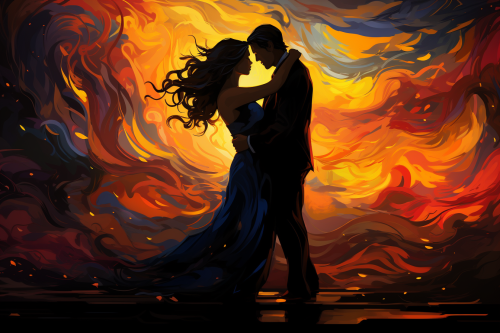
artistic creation of a drawing of a woman moving on after a breakup. Slow dancing I guess but sleak, vibrant colors --ar 3:2 --s 250
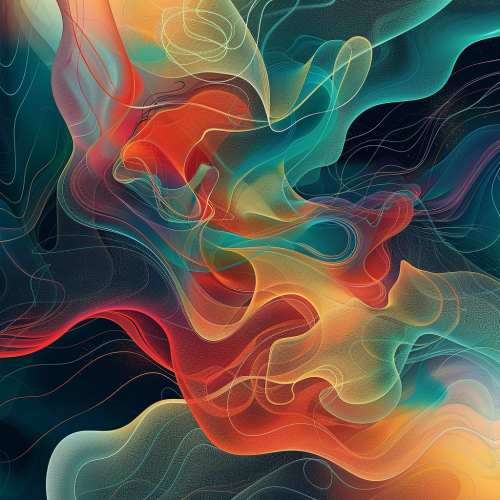
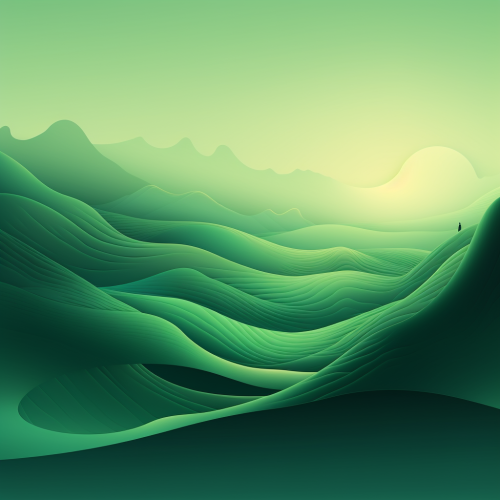
A conceptual map of emotions, with abstract shapes and colors representing different feelings, connected by fluid lines and gradients. The map has a modern, artistic design with a focus on color harmony and emotional depth. Vibrant colors, soft gradients, abstract lighting. Created Using: abstract art, modern design, fluid dynamics, emotional mapping, vibrant color palette, gradient blending, conceptual shapes, artistic interpretation, hd quality, vivid look --ar 1:1 --v 6.0
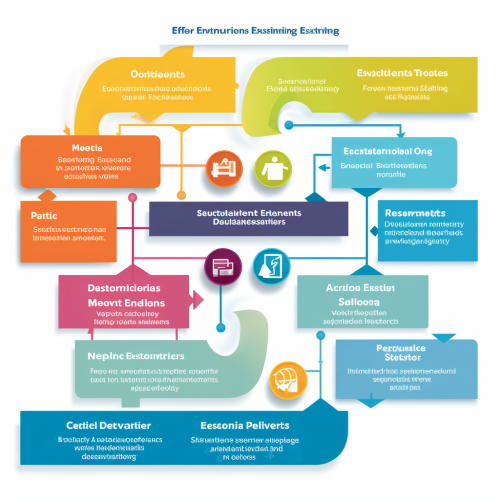
Envision a well-structured flowchart that intricately outlines the process of evaluating and refining employee benefits, fostering an enhanced Functional Operating Capacity (FOC) and uplifting organizational productivity. The flowchart initiates with a broad 'Benefits Evaluation' box that branches into several meticulous analysis paths including 'Data Analytics', 'Employee Feedback', and 'Health Metrics Analysis'. The 'Data Analytics' path delves into scrutinizing the utilization and effectiveness of current benefits, branching further into sub-categories like 'Usage Statistics' and 'Cost-Benefit Analysis'. Simultaneously, the 'Employee Feedback' path unfolds into 'Survey Responses' and 'Focus Groups', aiming to gather qualitative insights on employee satisfaction and perceived value of the benefits provided. The 'Health Metrics Analysis' pathway, on the other hand, zeroes in on evaluating the impact of current benefits on employees' health and Functional Operating Capacity, subdividing further into 'Physical Health Metrics' and 'Psychological Well-being Assessment'. These analysis paths converge into a central point labeled 'Benefits Refinement', signifying the amalgamation of insights derived. From here, a well-defined path named 'Benefits Optimization' emanates, symbolizing the iterative process of tweaking the benefits scheme based on gathered data to better cater to employee health and wellness needs. This section opens up to show various refined benefits like 'Improved Healthcare Coverage', 'Fitness Stipends', 'Mental Health Support', and 'Flexible Work Arrangements'. Finally, the flowchart culminates in a box labeled 'Enhanced Functional Operating Capacity & Organizational Productivity', illustrating the ultimate goal of this rigorous analysis and [...]
Artistic web design color gradients background, vibrant shades of blue and pink
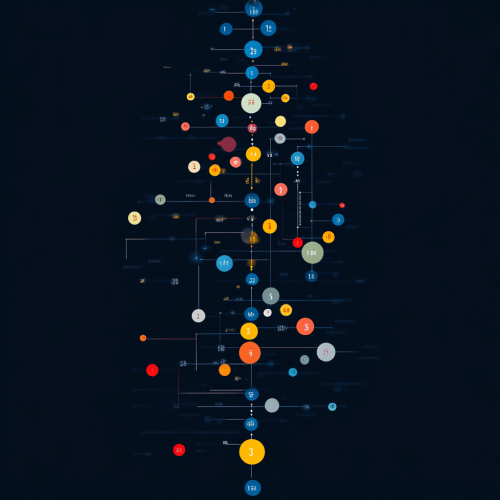
A diagrammatic portrait representation of A diagrammatic portrait illustrating the FizzBuzz challenge. The image shows a flowchart with numbers from 1 to 100, highlighting multiples of 3 with 'Fizz', multiples of 5 with 'Buzz', and multiples of both 3 and 5 with 'FizzBuzz'. The background is predominantly dark blue. --ar 1:1 --quality .5

A diagrammatic portrait representation of A diagrammatic portrait of the FizzBuzz coding challenge. The image features a flowchart with decision points for numbers divisible by 3, 5, or both. The background is a deep navy blue color, with nodes and arrows in white and light yellow colors, representing the logic flow of the FizzBuzz problem. --ar 2:1 --quality .5
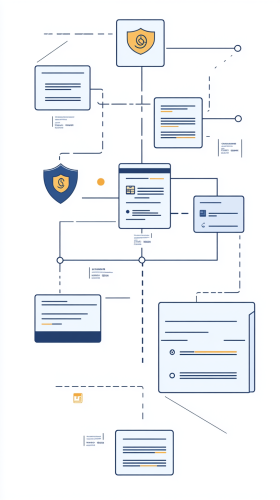
Create a simple, professional flowchart showing the flow of credit card payment data in a financial transaction with a county treasurer. Include three main steps: (1) a customer making a payment with a credit card, (2) a payment processor handling the transaction, and (3) the county treasury receiving the payment. Over each step, display a shield icon to represent security. Use clear, minimalist icons and light blue and gray color tones to convey trust and protection. --ar 9:16
abstract art background futuristic neon gradients --ar 3:2
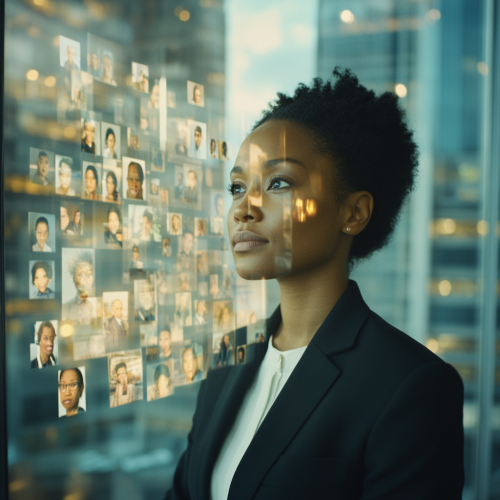
A professional and competent-looking Black woman in a suit, needing to make a hiring decision. She is in a tasetful, modern office space, looking thoughtfully out a large floor-to-ceiling window onto a large city. Projected onto the clear window are semi-transparent images of her thoughts and decision-making process – a cloud of headshots of the candidates, who are multicultural. Landscape orientation, 16:9 aspect ratio.
View Limit Reached
Upgrade for premium prompts, full browsing, unlimited bookmarks, and more.
Get Premium
Limit Reached
Upgrade for premium prompts, full browsing, unlimited bookmarks, and more. Create up to 2000 AI images and download up to 3000 monthly
Get Premium
Become a member
Sign up to download HD images, copy & bookmark prompts.
It's absolutely FREE
 Login or Signup with Google
Become a member
Sign up to download HD images, copy & bookmark prompts.
It's absolutely FREE
Login or Signup with Google
Limit Reached
Upgrade for premium prompts, full browsing, unlimited bookmarks, and more.
Get Premium