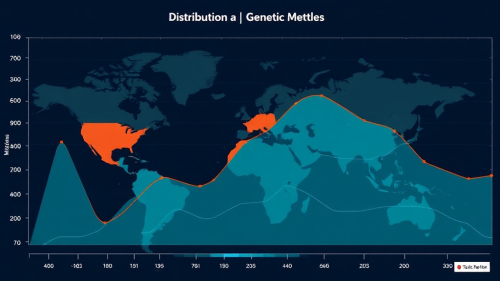
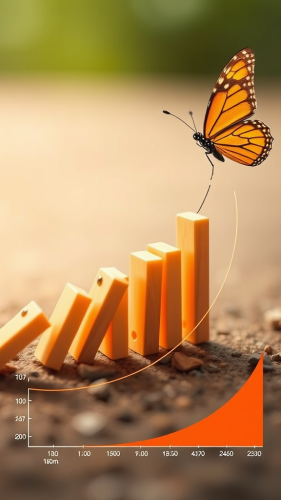
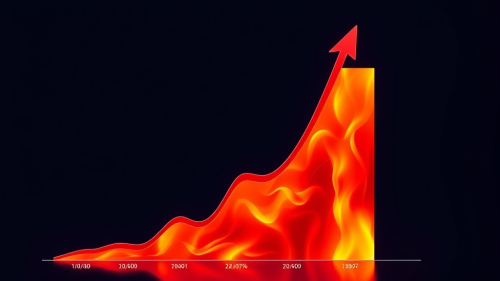
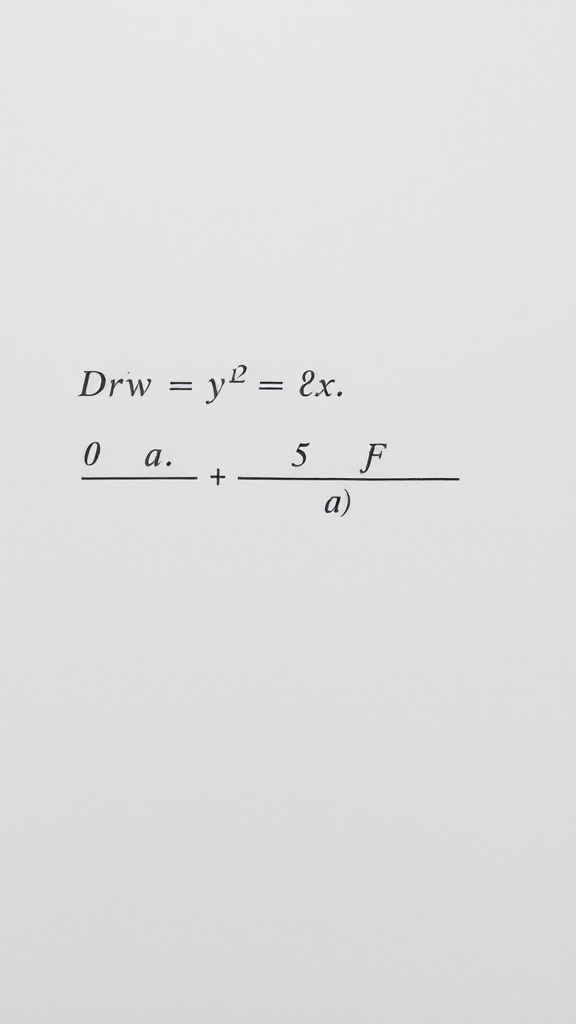
A graph showing a derivative function.
Prompt
2Moons Basic
27/10/2024
Portrait 9:16
License
Free to use with a link to 2moonsai.com
Prompt Ideas
Create better AI images using our prompt ideas section
economics supply and demand curve --ar 16:9 --v 6.0
Design graphique moderne représentant un homme égoïste entouré d'autres personnes, dans un style minimaliste et géométrique avec des formes nettes et des couleurs contrastées. L'homme est stylisé avec un visage exprimant l'égocentrisme, tandis que les autres personnes autour de lui sont représentées de manière simplifiée et distante, comme des silhouettes ou des formes abstraites. L'environnement est simple mais symbolique, avec des icônes de richesse ou de succès personnel mettant en évidence le contraste entre l'égoïsme de l'homme et les personnes qui l'entourent. L'image doit clairement montrer l'impact de son égoïsme sur ses relations et son environnement, tout en restant percutante et graphique. HDR, 8k, --ar 9:16
The image is a realistic image of a woman standing in full growth. On a black background with orange and dark blue colors, her facial expression expresses satisfaction as she looks at a graph where the lines go up and reach the growth points, the scale of the overall style combines elements of fantasy with realistic portraiture.
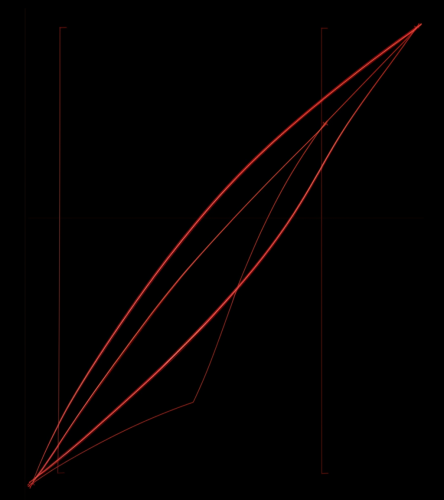
a simple line graph with an x and y axis. Black background. Single thick red line with a downward trajector from left to right --aspect 8:9 --v 5.0
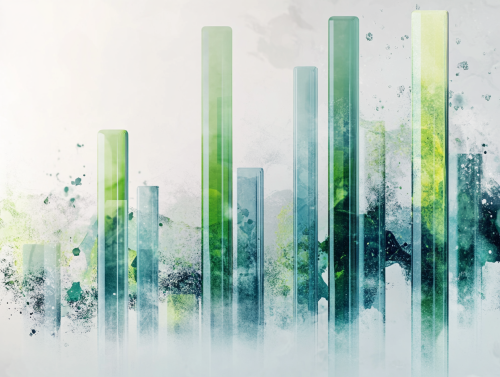
Generate a digital art for A digital art scene showcasing a dynamic bar graph with upward trends, representing increased revenue over time. The background is a soft light gray color, with vibrant colors like green and blue for the bars. The scene is modern and sleek, emphasizing growth and success. --ar 4:3
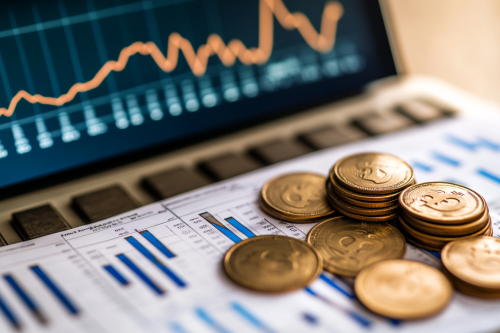
Depiction of interest rate fluctuations, featuring a graph with sharp increases and decreases on a digital screen, set in a modern financial workspace, clear focus on the chart, minimal background elements, representing dynamic changes in the financial market. Photorealistic, highly detailed, 8K resolution --ar 3:2 --v 6.1 --style raw
Moses parting the sea, with his arms raised. The sea is green. There are some green graph bars all over the sea. View from behind. Shocking, realistic image
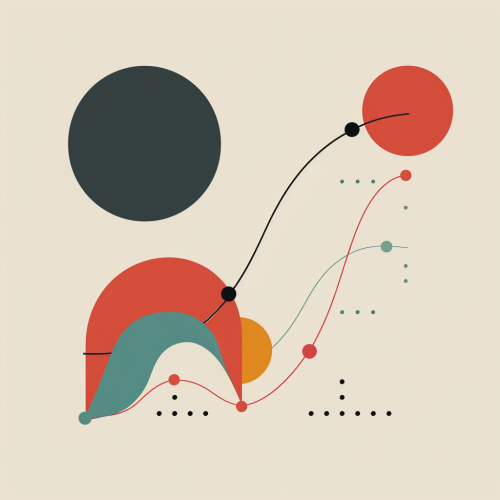
A stylized line graph with an upward trend, symbolizing growth and progress.
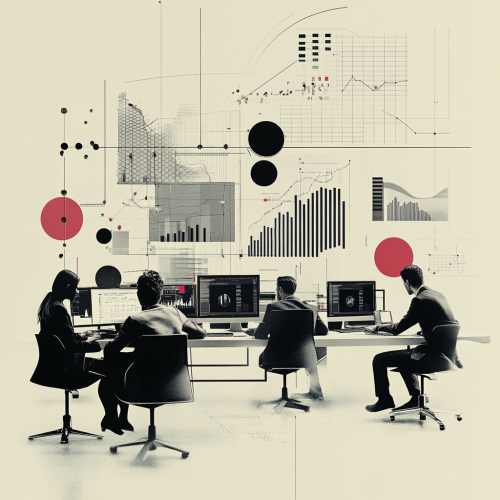
Generate a digital art for A digital art scene showing a project manager overseeing a team working on computers, with a visual representation of software implementation and a graph showing a 20% increase in productivity. Use light gray as the background color. --ar 1:1
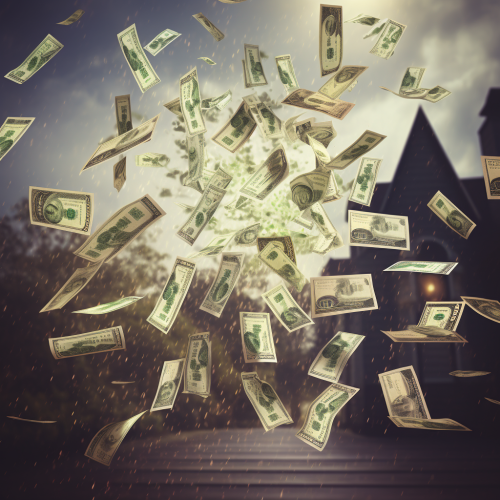
Graph showing home prices skyrocketing and dollar bills raining from the sky
cartoon style. graph showing ever increasing crime rate with arrow following the increase --ar 16:9 --v 6.0
Bitcoin logo stylized as a gradient desent of a error function
A logo featuring a sleek, upward-pointing geometric arrow or plant leaf that subtly transforms into a financial growth graph, symbolizing sustainable and exponential growth.
View Limit Reached
Upgrade for premium prompts, full browsing, unlimited bookmarks, and more.
Get Premium
Limit Reached
Upgrade for premium prompts, full browsing, unlimited bookmarks, and more. Create up to 2000 AI images and download up to 3000 monthly
Get Premium
Become a member
Sign up to download HD images, copy & bookmark prompts.
It's absolutely FREE
 Login or Signup with Google

Become a member
Sign up to download HD images, copy & bookmark prompts.
It's absolutely FREE
 Login or Signup with Google

Limit Reached
Upgrade for premium prompts, full browsing, unlimited bookmarks, and more.
Get Premium




 Download Image (SD)
 Download Image (HD)


